We highlight the rise of US equities markets for a third week in a row and overall the positive market sentiment seems to be maintained. The earnings season is still on yet most of the high-profile companies have already released their reports. In this report we are to discuss the financial and fundamental environment surrounding US stock markets, the earnings reports released, and for a more rounded view conclude with a technical analysis of the S&P 500’s daily chart.
Inflation and the Fed’s intentions
US stock markets got another push higher yesterday as the US CPI rates for October slowed down on both a headline and core level, lower than market expectations. Overall the release tended to improve the market sentiment and turn the markets towards a more risk-oriented approach. It’s characteristic that the headline CPI rate on a year-on-year level, slowed from September’s 3.7% yoy to 3.2% yoy while the core rate ticked down to 4.0% yoy for the same month. The release tended to solidify the market’s expectations for the Fed to abandon its rate-hiking path and remain on hold. It should be noted that according to Fed Fund Futures (FFF) the market now expects the Fed to remain on hold and proceed with a rate cut as early as May next year. Also, the release of October’s CPI rates overshadowed the statements made by Fed Chairman Powell last week in which the Fed Chairman hinted that more rate hikes would be possible if needed. We do not underestimate the possibility of some Fed policymakers continuing to lean on the hawkish side, given that the CPI rates are still substantially higher than the Fed’s target, yet we see the balance of power within the central bank as tilting towards a more cautious approach. We note as the next test for US stock markets the release of October’s PPI and retail sales growth rates for October later today and the Philly Fed business index for November and industrial output rate for October tomorrow. Other than that, we may see fundamentals leading the way as the frequency and gravity of US financial data ease. Thus would like to express our worries for the possibility of a US government shutdown that could weaken US stock markets should it be materialised.
Earnings releases
As for earnings releases, as we noted in our last report, we tend to focus more on the US retail sector this week. We had already the release of Home Depot’s (#HD) earnings report yesterday, with both the revenue and earnings per share figures being better than expected, yet lower than last year’s respective quarter and lower than last quarter. Nevertheless, the release tended to provide substantial support to the share’s price and allowed for a more optimistic outlook to emerge. On the negative side, the company has lowered even further the expectations for the 2023 revenue figure. Inflation seems to be still compressing consumption, yet Home Depot stated that the worst may be over. Today we note the release of JD.com’s (#JD) as a similar picture seems to be revealed with the earnings report out-beating market expectations on both the revenue and earnings figures, yet revenue fell for Q3. Nevertheless, the share’s price may be getting some support. We highlight the release of the earnings reports of Walmart (#WMT) and Ali Baba (#BABA). Especially Walmart, which has seen its share price continue to rise since around the 9th of October and is expected to show improved revenue and earnings figures if compared to last quarter the interest may heighten. Overall, we expect the interest around retailers to rise, given that Black Friday approaches and the Christmas season is to follow.
Microsoft’s meteoric rise
Microsoft’s share price continued to rise reaching record high levels, surpassing $370 per share. The company’s involvement in Artificial Intelligence seems to be fuelling the share price’s ascent. The latest development would be that as the week began OpenAI’s CEO is seeking new funding from Microsoft. The new funding is to back the company’s ambitions to create software as intelligent as humans. Furthermore, we also note Microsoft’s IT conference this week and it is expected to shed more light on the capabilities of Artificial Intelligence. Should one also consider the cloud storage and computing part of Microsoft’s business the possibilities of the company for the sector can be enhanced. Overall, we expect the positive sentiment of the market for Microsoft to be maintained and thus on a fundamental level the share’s price may remain supported in the coming week.
TECHNISCHE ANALYSE
US 500 Cash Daily Chart
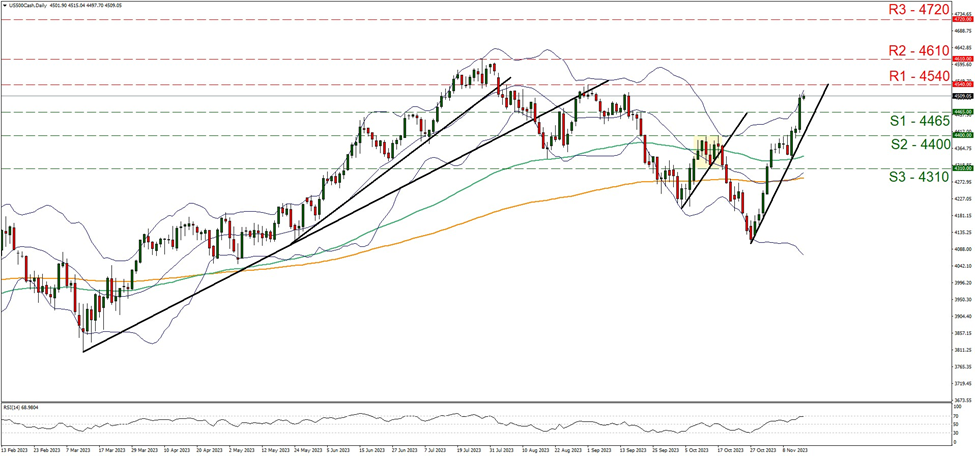
Support: 4465 (S1), 4400 (S2), 4310 (S3)
Resistance: 4540 (R1), 4610 (R2), 4720 (R3)
On a technical level, the S&P 500 jumped yesterday breaking the 4465 (S1) resistance line, now turned to support. We tend to maintain a bullish outlook for the index given that the upward trendline guiding it remained intact, while the RSI indicator below our daily chart, has reached the reading of 70, implying a strong bullish sentiment on behalf of the market. Yet the fact that the RSI is at 70 may also serve as a warning that the index is nearing overbought levels and may cause the bulls to hesitate or even the index to correct lower. Furthermore, we note that the index’s price action has reached the upper Bollinger band, also implying that the bulls may be slowing down. Should the buying interest be maintained, we may see the index breaking the 4540 (R1) resistance line and aim if not breach also the 4610 (R2) resistance nest. Even higher we note the 4720 (R3) resistance hurdle as a possible target for the bulls. Should on the other hand the index find extensive selling orders along its path, we may see it breaking the prementioned upward trendline, in a first signal that the upward movement has been interrupted, break also the 4465 (S1) support line and aim for the 4400 (S2) support base. In an extreme bearish scenario we may see the index reaching the 4310 (S3) support barrier.
If you have any general queries or comments relating to this article please send an email directly to our Research team at research_team@ironfx.com
Disclaimer:
This information is not considered as investment advice or an investment recommendation, but instead a marketing communication. IronFX is not responsible for any data or information provided by third parties referenced, or hyperlinked, in this communication.


