WTI prices fell to their lowest levels this month, crossing below the $75 per barrel mark of which crude spiked following OPEC+ surprise output cut announcement, as recession worries resurfaced. Earlier this month crude prices hit a five-month high but as growth concerns started to recirculate the market and the dollar came under pressure, WTI shed more than 10% of its value and 6% respectively in the past two sessions. In this report we aim to shed light on the catalysts driving WTI’s price, assess its future outlook and conclude with a technical analysis.
US GDP falls below estimates
Earlier today, preliminary growth data from the US for the first quarter of 2023 came in below expectations showcasing that the world’s largest economy is facing significant stress and may very well be on track to enter a recession in the second quarter of this year. More specifically the Q1 GDP rate was reported at 1.1%, far lower than expectations for a slowdown to the 2% level and the 2.6% of the previous quarter. The results could stir further market worries, which have reignited after a series of disappointing economic releases alongside the resurfacing of banking worries stemming from First Republic’s recent shortfalls. Adding more fuel to the fire, the prospect for tighter financial conditions from higher interest rates from central banks such as the Fed, ECB and BoE all of whom the scenario for 25 basis points hike is the go-to scenario in their respective upcoming meetings, could severely impact the demand levels for energy in the Western world.
Large stockpile drawdowns fail to support WTI prices
US crude oil inventories recorded large drawdowns for the second consecutive week, showcasing relatively strong domestic demand levels, however, crude prices maintained their downward trajectory seemingly unfazed. On Tuesday the weekly API crude oil inventories figure pointed to a drawdown of 6 million barrels in stocks, higher than the expectation of 1.6-million-barrel drawdown. Similarly, EIA’s weekly oil inventories recorded drawdowns of more than 5 million barrels, above estimates of 1.5 million barrels for the same period. The results suggest that demand picked up in the past week as domestic producers are eager to expand or at least maintain the current output levels of their activities. Given the results, we would have reasonably expected to observe a boost in crude prices, reflecting the increase in demand, yet that was not the case, possibly due to the worries for a recession having a one-sided negative effect on WTI. Lastly, we would like to point out that last Friday the Baker Hughes oil rig count report showed that the number of active oil rigs in the US, increased by a count of 3 reaching a total of 591, which could serve as another indication of increased demand for crude.
TECHNISCHE ANALYSE
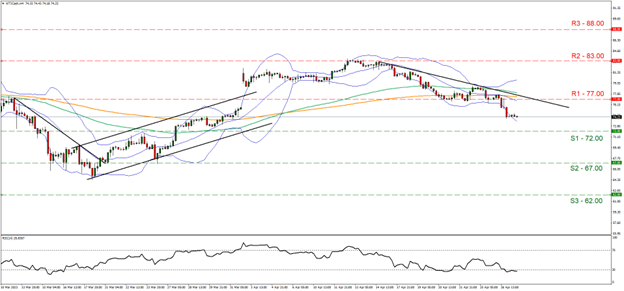
- Support: 72.00 (S1), 67.00 (S2), 62.00 (S3)
- Resistance: 77.00 (R1), 83.00 (R2), 88.00 (R3)
Looking at WTICash 4-hour chart we see observe crude extending its losing streak, plunging below the $75 per barrel level where prices spiked at the start of the month after OPEC’s surprise production cut announcement. We hold a bearish outlook bias for the commodity given that prices remain below the descending trendline, incepted on the 13th of April, and highlight the bears’ resolve to push prices lower. Supporting our case is the RSI indicator below our 4-hour chart which currently registers a value of 29, showcasing the extreme bearish sentiment that surrounds WTI in addition to the break of the lower bound of the Bollinger Band. Should the bears continue to reign, we may see the break below the 72.00 (S1) support level and the move near the 67.00 (S2) support base. We must note nonetheless that currently prices appear overextended and a possible correction higher may be due, as the bulls may be enticed to indulge in some dip buying activity. Should on the other hand the bulls step in, we may see the price climb and break past the 77.00 (R1) resistance level alongside the descending trendline and should the bullish momentum intensify we may see the crude prices climb even higher, near the 83.00 (R2) resistance barrier.
Disclaimer:
This information is not considered investment advice or an investment recommendation, but instead a marketing communication. IronFX is not responsible for any data or information provided by third parties referenced or hyperlinked, in this communication.


