
Emas continues its upwards trajectory reaching levels last seen before the debt ceiling deal. On a fundamental level, it seems that the inverse correlation between the dollar Dan gold is evident, as the weakening greenback has allowed gold to gain. In this report, we aim to shed light on the catalysts driving the precious metal’s price, assess its future outlook and conclude with a technical analysis.
US Employment data edges gold lower
Last Friday, the release of the US Employment data for May sent gold’s price to lower ground, as the mixed employment report surprisingly provided support for the greenback. The Employment report noted that the Unemployment rate increased faster than anticipated, from 3.4% to 3.7% whereas the Non-Farm Payrolls figure came in at 339k, compared to the expected figure of 180k. Thus, vastly exceeding analysts’ expectations of a loosening US labor market and in the aftermath of the Employment report, it appears that the NFP figure outweighed the increase in the Unemployment rate and as such provided support for the greenback. However, the greenback’s rise was only temporary, as yesterday the ISM Non-Manufacturing PMI figures for May, came in lower than expected which was indicative of the Services industry expanding but at a slower rate. The ISM Non-Manufacturing PMI figures, re-ignited fears that the US economy is not as resilient as was previously anticipated and as such spiked fears of a potential US recession in the near future. Therefore, gold may have received safe haven inflows given its status as a hedge against times of economic uncertainty.
FOMC blackout period in full swing
We are currently in the FOMC’s blackout period, with the monetary policy meeting set to take place on the 14th of June, we highlight the difficult decision faced by Fed policymakers. One of the last Fed policymakers that spoke before the blackout period was Philadelphia Fed President Harker, who’s comments about potentially skipping the FOMC’s next meeting, was perceived as dovish with the inclination that the Fed may pause its aggressive interest rate policy. The comments made by Philadelphia Fed President Harker, may have been a key factor behind the dollars weakening, as it could hint that the Fed is nearing its terminal rate at a faster pace than previously anticipated .In addition, despite the employment data, it is our own personal view that the Unemployment rate may be the predominant factor in the Fed’s interest rate decision which is due next week on the 14th of June. Market analysts expect the Fed to pause in its next meeting, with our own personal view being that, should the Fed pause, the forward guidance may lean slightly to the hawkish side, suggesting future rate hikes in the future. Whereas should the Fed hike, our view is that the forward guidance may lean towards the dovish side by hinting an earlier than expected rate cut or at the very least a pause. In conclusion, as the Fed’s interest rate decision nears, we may the precious capitalizing on a weaker dollar, as the market sentiment currently appears to be leaning towards an interest rate pause, rather than a rate hike.
Debt ceiling deal calms market worries
The drama surrounding the US defaulting on its debt has evaporated, following, last week’s decision by the House of Representatives and the Senate to vote in favour of raising the debt ceiling. As a result, market worries of a catastrophic scenario have now dissipated, with the greenback temporarily receiving inflows, as investors regained confidence in the US economy. The raising of the debt ceiling resulted in a stronger greenback and given the precious’ perception of being a hedge in times of economic uncertainty, the aversion of a US default led to the gold bullion weakening.
Technical Analysis – Gold
XAUUSD H4 Chart
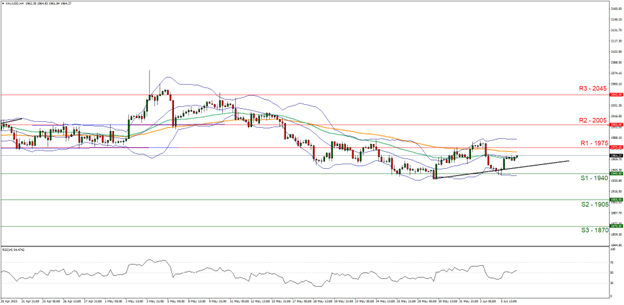
- Support: 1940 (S1), 1905 (S2), 1870 (S3)
- Resistance: 1975 (R1), 2005 (R2), 2045 (R3)
At the time of this report, Gold’s price moved in an upwards fashion since last week, forming an upwards trendline since the 30th of May. We tend to maintain a bullish outlook for gold’s price as long as its price action remains above the aforementioned upward trendline, in addition to the RSI figure remaining above the reading of 50. Furthermore, we note that the price action failed to break below support at 1940 (S1) and then moved higher, combined with the breaking above the 50 RSI figure, may imply a bullish market sentiment. For our Bullish outlook to continue, we would like to see a clear break above resistance at 1975 (R1), with the next potential target for the bulls being the 2005 (R2) resistance ceiling. On the other hand, for a bearish outlook we would like to see a clear break below the 1940 (S1) level which would coincide with the breaking below the upwards trendline and as such the next possible target for the bears may be the 1905 (S2) support base. Lastly, should the pair fail to break below atau above the aforementioned S1 Dan R1 levels, in addition to the RSI indicator fluctuating around the reading of 50, we may see the precious move in a sideways fashion between the 1975 (R1) and 1940 (S1) levels.
Disclaimer:
This information is not considered investment advice or an investment recommendation, but instead a marketing communication. IronFX is not responsible for any data or information provided by third parties referenced or hyperlinked, in this communication.


