
Even though major US stock markets fell to a new weekly low in the past days, they managed to regain the ground lost and are currently in positive territory for the week. As the FOMC meeting takes place today in the American session, we could expect the market to react to any new announcements and comments made during the event. On the other hand, the ongoing earnings season is keeping investors in anticipation as opportunities are displayed almost on a daily basis. This report will overview some interesting stock movers from the previous days presenting the latest updates related to them. As a closure one of the stocks selected will be used for our technical analysis.
American Express at the top of the gainers list
At the top of the list of the S&P500, was American Express (#AXP) as on Tuesday the 25th, the company released its earnings results for Q4 2021. For the day, American express moved higher and gained +8.92% closing the session at $173.11 per share. According to its official website, American Express’s Stephen J. Squeri, the Chairman and Chief Executive Officer noted that the company managed to produce revenue growth of 30 percent in the fourth quarter and 17 percent for the full year. These figures where achieved with growth in Card Member spending compared to the prior year as the report noted. On the contrary, a notable increase of 22% in yearly consolidated expenses lifted the overall amount to $33.1 billion, from previous $27.1 billion a year ago. The company said they increased their investment in marketing to support the brand further. Even though revenues seem to pay up for the investments, the company may need to bring expenses lower in the near future to avoid limiting long term growth. AXP’s 52 week price range is currently between $112.10 and $189.03, while its year to date rate stands at +5.81% so far.
IBM on the move as EPS exceeds expectations
IBM was also among the top winners under the Dow Jones on Tuesday as the company gained +5.65% and closed the session at $136.10. IBM released its earnings report for Q4 2021, on Monday the 24th of January. According to IBM’s official report, IBM delivered $16.7 billion in revenue, 58 percent operating gross margin, operating pre-tax income of $3.5 billion and operating EPS of $3.35 for continuing operations. According to these figures, total revenue growth was at 9% which includes Kyndryl which is IBM’s Independent Managed Infrastructure Services Business. Kyndryl could be currently contributing approximately over 3% to the overall revenue growth of IBM, making it a rather significant and possibly promising part of the business. For the fourth quarter, IBM also noted it saw an increase in two key areas of business including, Software which was up 10 percent, and Consulting that gained 16 percent. IBM’s business has evidently grown, yet investment in consulting is continued. Looking forward in 2022, IBM has stated it expects a free cash flow of $10-10.5 billion. We would like to advise caution as future projections with the current global uncertainty could be challenging to achieve. IBM’s 52 week price range is currently between $112.18 and $145.99, while its year to date rate stands at +1.83% so far.
Microsoft falls in red territory yet earnings results impress
Microsoft (#MSFT) was among the companies that lost ground Tuesday as it left behind -2.66% and closed the session at $288.49. This may have been a follow-up of the overall trend that found the stock markets falling to negative territory. Microsoft released its earnings report for Q4 2021, on Tuesday the 25th of January. According to Microsoft’s official website, the company’s revenue for the final quarter of 2021 stood at $51.7 billion and increased 20% compared to the same quarter in 2020. Revenues increased throughout of Microsoft’s operations including Productivity and Business Processes, Intelligent Cloud and Personal Computing. Some analysts tend to highlight the firms Cloud growth which seems to be among the strongest points for Microsoft currently. Yet in our opinion, Microsoft’s considerable investment in Activision tends to speak louder at the moment, displaying the company’s eagerness to expand further with gaming and possibly the metaverse. Microsoft’s 52 week price range is currently between $224.22 and $349.67, while its year to date rate stands at -14.22% so far.
Analisis teknikal
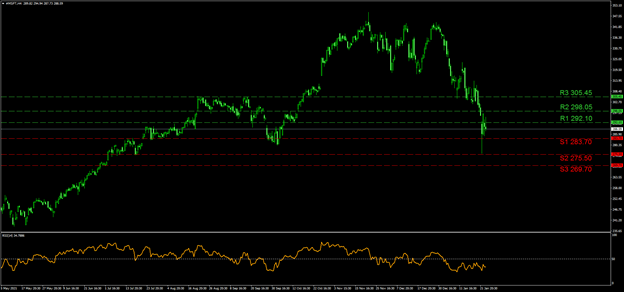
At the moment, the price action remains between the (R1) 292.10 resistance and the (S1) 283.70 support level. On the 24th of January the price action breached the (S1) level and briefly tested the (S2) 275.50 level barrier. Yet the price action rebounded soon and headed higher surpassing the (R1) line and approaching the (R2) 298.05 hurdle. This can be an indication that the range between the (R2) and the (S2) is important for the time being. If the share comes under strong bullish interest then the (R3) 305.45 could become a target. In the opposite direction a bearish sentiment can send the price action towards the (S3) 269.70 level. The RSI indicator below our chart is running below the 50 level given the slump Microsoft’s share price has been in since late December. Thus, in our opinion the share remains in a selling trend line and a possible breach above the (R2) can help reverse the current trend.
If you have any general queries or comments relating to this article please send an email directly to our Research team at research_team@ironfx.com
Disclaimer:
This information is not considered as investment advice or an investment recommendation, but instead a marketing communication. IronFX is not responsible for any data or information provided by third parties referenced, or hyperlinked, in this communication.


