
Oil prices have started to drop in the past two days, with analysts citing the interest rate decisions of various central banks as a possible reason. Yet the overall environment for the oil market seems to still be characterised by a tight supply side, while the demand side tends to remain uncertain. In this report, we aim to shed light on the factors driving WTI’s price, assess its future outlook and conclude with a technical analysis of Brent.
US oil market starts tightening once again
We make a start as usual with the data for the US oil market in the past week. We note that the Baker Hughes oil rig count continued to rise and showed a number of 515 active oil rigs in the US, implying that demand is on the rise. It should be noted though that the number of active oil rigs despite rising slightly is still a far cry away from the number of active oil rigs in the US about a year ago. Furthermore, the API weekly reading indicated that US oil inventories have dropped by -5.250 million barrels while EIA also reported a drop in oil inventories yet a lower number of -2.135 million barrels. Despite the divergence in the figure, the common part of the two releases tends to imply that oil demand was able to surpass production levels, implying a relative tightness in the US oil market. Should that status be maintained also by next week’s reading, we may see oil prices getting some support.
Interest rate decisions affect demand expectations
On the demand side of the oil market, we note the argument on whether global oil demand is to peak by 2030 or not, yet for the time being we view such a scenario as too far off to affect oil prices. Market focus tended to be on the release of a number of interest rate decision this week, starting with the Fed. The bank maintained rates unchanged as was expected, yet also implied that another rate hike could be delivered, further down the line and the markets’ expectations for rate cuts in the coming year were too high. So overall the bank’s restrictive level of monetary policy is expected to remain for a prolonged period, something that may have an adverse effect on economic activity in the US and thus on oil demand. The market may have been expecting such a release by the Fed, at least partially and that may have forced oil’s price lower. Should such expectations continue to grow over the coming days we may see them continuing to weigh on oil prices. Across the world, despite seeing some positive signs regarding China’s economic recovery the big picture still is being characterised by uncertainty, which in turn may also weigh on oil prices.
Shale oil production drops
On the other hand the outlook for a tight supply side, characterized by OPEC’s low production levels is being maintained and may have clipped the drop of oil prices in the past few days.
Yet it’s not only OPEC and its allies, also US shale oil producers have started to lower production levels over the past two months and is expected to fall also in October. The issue is reported to be even more intense as crude output in the Permian Basin in 5.773 million barrels per day (bpd) the lowest level since April as reported by Reuters. The news may have created some doubt about the possibility of US shale oil being presented as a partial alternative to the low production levels of Saudi Arabia. Despite EIA’s prediction that the production is still to reach record high levels in 2023 and possibly to be exceeded in 2024, such worries may support oil prices. Even with current numbers the news tend to display a rather muted reaction of shale oil producers to the increase of oil prices over the past month. Overall, we tend to see the persistence of low production levels as being more consistent and may in the future if not the coming week, be able to provide renewed support for oil prices on a fundamental level.
Analisis Teknikal
WTI Cash Daily Chart
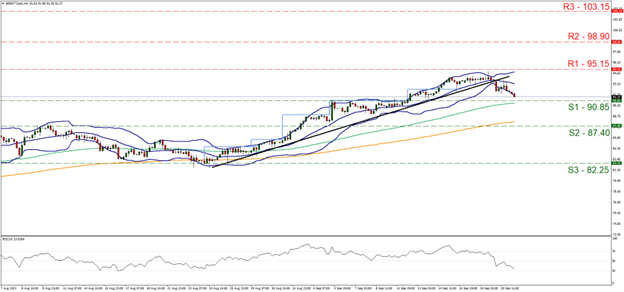
- Support: 90.85 (S1), 87.40 (S2), 82.25 (S3)
- Resistance: 95.15 (R1), 98.90 (R2), 103.15 (R3)
Brent’s upward movement was interrupted and the commodity’s price is now nearing the 90.85 (S1) support line. Given that the commodity’s price has broken the downward trendline guiding it since the 24th of August and that the RSI indicator is nearing the reading of 30, we tend to switch our bullish outlook in favour of a bearish one. Yet the price action seems to have hit the lower Bollinger band, which in turn may slow down the bears. For a clearcut bearish outlook we would require the pair to break the 90.85 (S1) support line, a level that was used as a resistance line yet as the price action has moved higher, has switched its role. Should S1 be broken we may see the commodity’s price take aim of the 87.40 (S2) support base while even lower we note the 82.25 (S3) support level, which held its ground against the selling pressure near the 24th of August.
On the flip side, should drop of the commodity’s price prove to be a mere correction lower and the bulls regain control over Brent’s price action, we may see its price breaking the 95.15 (R1) resistance line and aim if not break the 98.90 (R2) resistance level. As the ultimate target for the bulls, we bypass the psychological barrier of $100 per barrel and set the 103.15 (R3) resistance level that was able to cap the upward motion of the commodity’s price on the 29th of August last year.
Disclaimer:
This information is not considered investment advice or an investment recommendation, but instead a marketing communication. IronFX is not responsible for any data or information provided by third parties referenced or hyperlinked, in this communication.
