

Since our last report, today we will be discussing the fundamental factors influencing the direction of gold prices, which have recently reached new record highs. Issues like the uncertainty created in the market by US President Trump’s tariffs, the perception of a negative correlation of gold with the USD, any news regarding central bank buying and the Fed’s stance are to be discussed. At the end we are also to include a technical analysis for gold’s daily chart in order to provide a rounder view for the trading instrument.
Negative correlation of gold to USD rejuvenated?
Over the past few days the negative correlation of the USD with gold’s price seems to have been largely rejuvenated, as the precious metal’s price rose reaching new record high levels while the USD index fell for the past three days, while gold’s price rose has been rising for a few days now pausing yesterday.
We would like to see clearer evidence regarding the negative correlation of the two trading instruments before adopting a rejuvenation of it on a fundamental level. At the same time we also note the rise of US yields over the past few days since our last report and their relative stabilisation at high levels.
The course of yields should make US bonds more attractive for investors thus weighing on gold’s price, given the antagonistic nature of the two investment instruments (gold and US bonds). Yet gold traders were not influenced by the rise of US yields and safe haven inflows continued to reel in for the precious metal, as the uncertainty of investors is also based on the possibility of a recession in the US economy.
Hence we see a possible decoupling of gold with bonds for the time being and should market worries for a possible recession in the US economy intensify, we may see gold’s price getting more safe haven inflows.
Uncertainty over Trumps’ trade wars maintained
The trade wars instigated by US President Trump continue to stoke uncertainty in the markets, which in turn continue to drive safe haven inflows for the precious metal.
In a latest development, US President Trump, announced that he is to announce tariffs on semiconductors and possibly pharmaceuticals, practically citing the need for the US to be self sufficient on these products.
On the flip side White House officials are signaling the possibility of separate trade deals being possible for individual countries, while also US President Trump announced that high tech products could be exempted practically blurring the picture of the overall issue.
We maintain the view that the trade wars may continue tantalizing the markets for the coming days and any further escalation could create further safe haven inflows for the precious metal, while any easing of the market worries could weigh on gold’s price.
The Fed’s stance
In the coming days with the exception of the US retail sales we have no major financial releases on the calendar stemming from the US, hence we expect fundamentals to lead the markets especially gold traders. As we have allready commented on Trump’s trade wars, we note on a monetary level that should Fed policymakers reiterate in the coming days, their doubts for extensive rate cuts.
We may see gold’s price weakening while any enhancement of the market sentiment for more rate cuts to come by the bank could support gold’s price, as was the case with Fed Board Governor Waller yesterday.
We also are worried for any signs of recession in the US economy with inflation being at the same time at relatively high levels, and any market worries to that end could enhance support for gold’s price and vice versa.
Gold Technical Analysis
XAUUSD 4H Chart
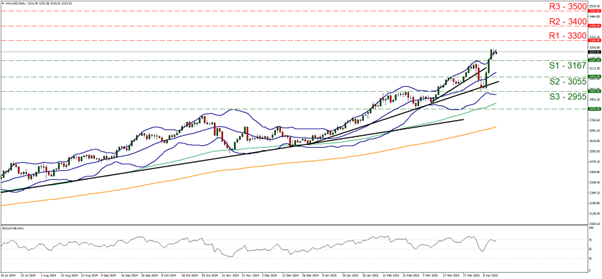
- Support: 3167 (S1), 3055 (S2), 2955 (S3)
- Resistance: 3300 (R1), 3400 (R2), 3500 (R3
Technically we note the rally of gold’s price since our last report with the precious metal price bouncing on the 2955 (S3) support line and then breaking consecutively the 3055 (S2) and the 3167 (S1) resistance lines, both now turned to support and culminating around the $2250 per troy ounce level.
Given that gold’s price in its upward movement was able to form a new higher trough and higher peak, reaching new record highs and respecting the upward trendline guiding its since the 3oth of December last year we maintain a bullish outlook for the precious metal’s price.
Yet as a word of warning we also note that the RSI indicator has reached the reading of 70, which on the one hand showcases the strong bullish sentiment among market participants yet on the on the other highlights that the precious metal’s price is nearing overbought levels, thus becoming ripe for a correction lower.
Similar signals are coming from the price action flirting with the upper Bollinger band. Should the bulls maintain control over gold’s price, we may see it setting out to new, unchartered territories, breaking the 3300 (R1) resistance line and we set as the next possible target for the bulls the 3400 (R2) resistance level.
A bearish outlook seems currently remote and for its adoption we would require gold’s price to break the 3167 (S1) support line, the 3055 (S2) support level and continue lower to break the prementioned upward trendline signaling the interruption of the upward movement and proceed to also break the 2955 (S3) support level, allowing gold’s price to form a lower trough.
Disclaimer:
This information is not considered investment advice or an investment recommendation, but instead a marketing communication. IronFX is not responsible for any data or information provided by third parties referenced or hyperlinked in this communication.


