
US stock markets sent mixed signals since last week with the NASDAQ 100 moving higher whilst the S&P 500 remain relatively unchanged and the Dow Jones 30 moving lower, as market fears of the US defaulting on its debt have alleviated, following progress by US lawmakers to resolve the debt ceiling standoff. In this report we aim to present the recent fundamental and economic news releases that impacted the US stock markets, look ahead at the upcoming events that could affect their performance and conclude with a technical analysis.
US debt ceiling talks appear to be moving forwards
Last week, the NASDAQ 100 gained ground, whilst the Dow Jones 30 declined and the S&P 500 remained relatively unchanged, as the probability of a US default decreases. Following the tinggi–level talks between US lawmakers, the risk of the US defaulting on its debt has eased, as post-meeting statements indicated progress and contained strong wording, that the US would not be allowed to default diffusing excess worries in equities markets. Aiding to the fall of Dow Jones 30 index yesterday, was Home Depot whose earnings releases caused waves in the markets, after posting its biggest revenue miss in more than two decades. The earnings result, dealt a 2% blow to its stock’s price, as in the forward outlook the company expects sales to decline between roughly 2% and 5% for the entirety of 2023, painting a gloomy picture for the home improvement retail giant and the probability that the Fed is likely to continue hiking rates, traders fear that consumer staples companies may be amongst the first to feel the negative implications of tight economic conditions stemming from restrictive monetary policy practices. However, there is an outlier amongst the equities markets, being the NASDAQ 100, which is currently on four-week winning streak defying expectations. This could be attributed to the AI generated hype around companies, albeit of which some are just remotely connected to the development of Artificial Intelligence, hence propping up their stocks like helium balloons that are just waiting to pop once the reality sets in, in a 2000’s dotcom-bubble fashion. In addition, since the majority of companies have already posted their earnings for Q1, it is likely that the US equities markets are primarily driven by external factors such as the FX market, where a strengthening dollar has taken the spotlight away, as the banking fears subside Dan progress is made on raising the debt ceiling in order to avoid a US default.
BAIDU leads the way forward for China’s equities markets
Baidu, the Chinese behemoth announced its quarterly earnings report on Tuesday, beating revenue Dan earnings estimates, as market attention turns back towards the Cina economy‘s rebound following it’s re-opening in November. The better than anticipated earnings report is indicative of a continued confidence by investors in the Chinese equities markets which is still stronger than its American counterparts, as the latest growth data indicated that the economy grew by 4.5% in the first quarter. In addition, the company stated that certain elements of its businesses are experiencing demand approximating pre-pandemic levels, potentially providing investors with a greater than expected optimistic outlook. Furthermore, Baidu has also capitalized on the recent AI frenzy that has taken the world by the reigns and has announced that it is currently waitingfor its ChatGPT alternative “Ernie Bot” to receive regulatory approval from the responsible Cina authorities. In the event that Baidu’s “Ernie Bot” gains approval by state regulators, it would allow the search engine goliath to tap into a booming tech industry, given that the recent tensions between China and the US would most likely make it more difficult for Foreign AI companies to enter the Chinese markets.
Analisis Teknikal
#BIDU DAILY Chart
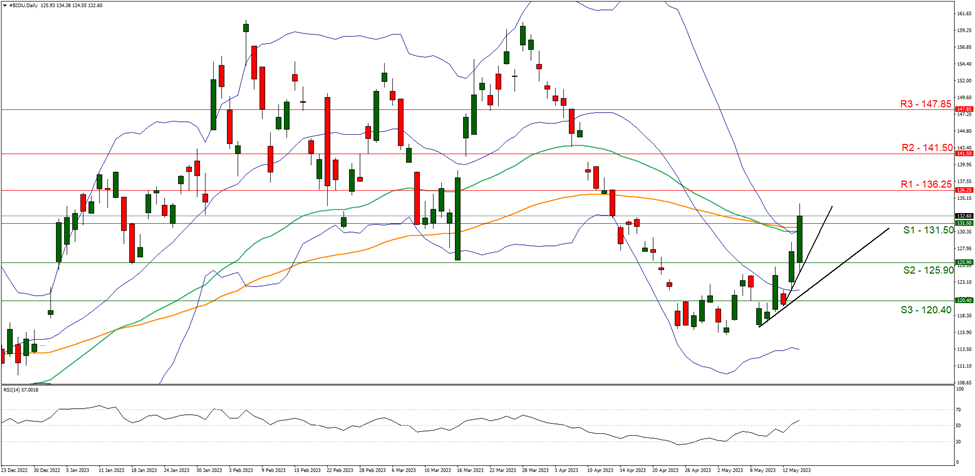
Support: 131.50 (S1), 125.90 (S2), 120.40 (S3)
Resistance: 136.25 (R1), 141.50 (R2), 147.85 (R3)
Looking at #BIDU Daily chart we observe investors reacting favorably to the positive earnings report from the company, as the stock has in its sights the 136.25 (R1) resistance line and its guided to higher ground by the formation of an upwards trendline on the 12th of May. We hold a bullish outlook bias for Baidu as the stock continues to validate our upwards moving trendline and supporting our case is the RSI indicator below our daily chart, which broke above the reading of 50 and is now heading for the 70 figure. For our bullish outlook to continue, we would like to see a break above the 136.25 (R1) resistance line with the next potential target for the bulls being the 141.50 (R2) resistance barrier. For a bearish outlook, we would like to see a clear break below the 131.50 (S1) support level followed by the potential testing of support at the 125.90 (S2) level.
If you have any general queries or comments relating to this article please send an email directly to our Research team at research_team@ironfx.com
Disclaimer:
This information is not considered as investment advice or an investment recommendation, but instead a marketing communication. IronFX is not responsible for any data or information provided by third parties referenced, or hyperlinked, in this communication.


