US stock markets tended to remain relatively unchanged in the past few days, maybe even edged a bit lower. We saw that the Fed’s hawkish stance, despite skipping a rate hike in the past meeting had little effect on US stockmarkets. In this report, we aim to present the recent asas Dan economic news releases that impacted the US stock markets, look ahead at the upcoming acara that could affect their performance and conclude with a teknikal analysis.
Fed’s interest rate decision to remain on hold
The Fed last Wednesday decided to remain on hold as was widely anticipated. Furthermore, Fed Chair Powell reiterated on numerous occasions that despite remaining on hold, this does not mean that the Fed is done with hiking interest rates, thus leaving the door open for future rate hikes. Characteristically he also stated that rate cuts are “a few years out” which contradicted market expectations for the bank to proceed with rate cuts by the end of the year. Interestingly, the Dot plot moved higher released after the FOMC interest rate decision, with Fed policymakers now anticipating the Fed’s terminal rate to be higher than what was previously anticipated with the median rate by the end of the year now being 5.6%, which would imply that the bank has still to deliver two more rate hikes before year’s end and before pausing its rate hiking path. We would also like to highlight that in the banks’ projections, the possibility of a recession in the US economy seems to have been reduced, which in turn may provide some support for US stock markets. Overall though and for the time being we expect the bank to continue to lean on the hawkish side a scenario that could weigh on US equities markets. We would like to highlight as the next big test for US stock markets the testimony of Fed Chairman Powell before Congress and should he sound hawkish enough, we may see US stock markets retreating and vice versa.
China’s rebound stalls
Sticking to equities fundamentals we note the market worries for the recovery of the Cina economy. On a macroeconomic level, it should be noted that China’s trade surplus narrowed to one-year lows, an indication of fewer international trading transactions and thus lesser wealth entering the Cina economy. Yet that could be a consequence of the contraction of economic activity suffered by China’s crucial manufacturing sector. It’s characteristic that the Urban investment, industrial production Dan retail sales growth rates, all slowed down for May underscoring the difficulties faced by the Chinese economy on its road to recovery. For the time being, we note that the Central Bank of the People’s Republic of China cut lending rates in an effort to boost activity in the Chinese economy, yet the cuts delivered may not be sufficient to revive it. Overall should the difficulties for the Cina economy to recover be extended we may see the market sentiment turning risk averse, as the optimism could be reduced with negative consequences for US stock markets. On a deeper level, we also note the conflicting messages sent on a political level. Despite the initial positive signals coming from US Foreign Secretary Blinken’s visit to China that tensions between the two countries may start thawing or at least may not escalate further, US President Biden calling China’s leader Xi as a “dictator” is not expected to go down well with the Cina. Further escalations of tensions in the US-Sino relationships may intensify market worries.
Analisis Teknikal
US100 (Nasdaq) Daily Chart
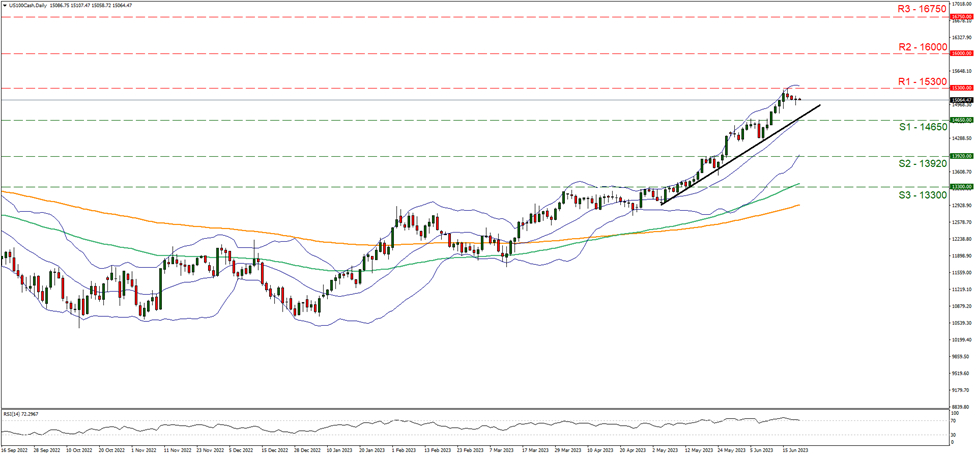
Support: 14650 (S1), 13920 (S2), 13300 (S3)
Resistance: 15300 (R1), 16000 (R2), 16750 (R3)
Nasdaq’s rise over the past month seems to have hit a ceiling on the 15300 (R1) resistance line Dan corrected a bit lower. For the time being we view the consolidation of the index’s price action as a mere correction for now, given that the upward trendline guiding the index remains intact. Furthermore please note that the RSI indicator despite correcting a bit lower is still above the reading of 70 underscoring the bullish sentiment of the market, yet may also imply that the index is currently at overbought levels and needs to correct even lower. Please note that the consolidation lower of Nasdaq’s price action began after it hit on the upper Bollinger band, which allowed for some room to be created between the price action and the upper Bollinger band, hence the bulls may have space to cover. Should the bulls maintain control over the index’s direction, we may see Nasdaq breaking the 15300 (R1) resistance line and aim for the 16000 (R2) resistance barrier. On the flip side for a bearish outlook the current correction lower is not enough. To call in the bears, we would require Nasdaq to drop below the prementioned upward trendline, in a first sign that the upward movement has been interrupted, break the 14650 (S1) support line clearly and start aiming for the 13920 (S2) support level.
If you have any general queries or comments relating to this article please send an email directly to our Research team at research_team@ironfx.com
Disclaimer:
This information is not considered as investment advice or an investment recommendation, but instead a marketing communication. IronFX is not responsible for any data or information provided by third parties referenced, or hyperlinked, in this communication.


