
Crude prices have been on the rise for the second consecutive week after their sharp, yet brief drop to their lowest levels in over 15 months, primarily supported by a combination of factors such as strengthening trading ties of Saudi Arabia 그리고 China, and the dispute between Turkey 그리고 Kurdish authorities that halted exports of around 400,000 barrels from a port in Turkey. What has put a ceiling on top of oil prices over the last week has been the disappointing announcement from the US administration that replenishing the depleted SPR inventories would take years to complete alongside Russia’s production shortcomings in terms of output since the start of March. In this report we aim to shed light on the catalysts driving WTI’s price, assess its future outlook and conclude with a technical analysis.
US Department of Energy cites problems at restocking SPR inventories
Late last week, the US Energy Secretary Granholm announced that the US Energy Department would stave off crude purchases aimed at replenishing the Strategic Petroleum Reserves of the country and cited that the replenishing process would take years to complete. Biden administration officials have stated early January, that the US will replenish its crude stocks once WTI’s price edges closer to their $72 to $67 per barrel range and that a calculated purchasing phase would take place, once the pricing conditions are at or below the favorable range. The US tapped its Strategic Petroleum Reserves back in 2021, as President Biden ordered a 50-million-barrel release amidst the rapid increase of petrol prices and another humongous 180-million-barrel release around September of 2022 following Russia’s full-fledged invasion in Ukraine, to keep a lid on petrol prices and protect the public at the pump. The enormous drawdowns left the strategic reserves severely depleted and currently stand at their lowest levels since 1983 according to EIA. Even though government officials have stated in the past the administration is in no rush to replenish the reserve, energy traders nevertheless were expecting a large purchase and since that didn’t happen, they downgraded their optimistic bets, dragging momentarily WTI prices to lower ground.
Drawdowns in crude stocks end month-long pileups
Last week crude oil inventories in the US recorded unexpected large drawdowns, interrupting multiweek pileup streak. On Tuesday the weekly API crude oil inventories figure pointed to a drawdown of 6 million barrels in stocks, higher than the expectation for a pile up of nearly 200 thousand barrels, while yesterday EIA’s weekly oil inventories recorded an unexpectedly large drawdown of 7.5 million barrels of crude, exceeding expectations of a mere 100 thousand pile up for the same period. The results suggest that demand for crude has increased over the past week, with US economy feeling more optimistic about the expansion of its activities. The results did provide support slight for WTI however, different divergent factors appear to be at play currently. Lastly, we would like to point out that last Friday the Baker Hughes oil rig count report showed that the number of active oil rigs in the US, increased by a count of 4 reaching a total of 593, which could serve as another indication of increased demand for crude.
기술적 분석
WTICash 4H Chart
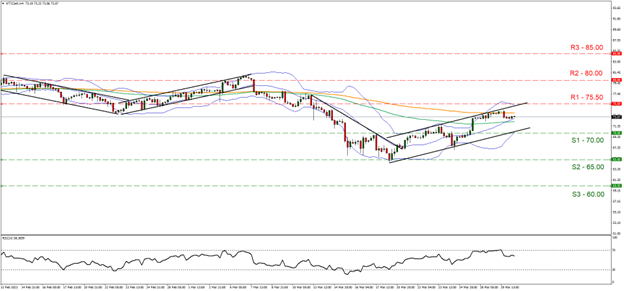
- Support: 70.00 (S1), 65.00 (S2), 60.00 (S3)
- Resistance: 75.50 (R1), 80.00 (R2), 85.00 (R3)
Looking at WTICash 4-hour chart we see crude extending its climb to higher ground the past week as indicated by the ascending channel, and it is currently gearing up to challenge the 75.50 (R1) resistance barrier. We hold a bullish outlook bias for the commodity given its short-term upward trajectory and supporting our case is the RSI indicator below our 4-hour chart which registers a value of 62, showcasing bullish sentiment surrounding WTI. Should the bulls extend their dominance, we may see the break above the 75.50 (R1) resistance level and head towards the 80.00 (R2) resistance barrier. Should on the other hand the bears take over, we may see the break below the lower bound of the ascending channel, the break of the 70.00 (S1) support level and the retracement to lower ground, closing in the 65.00 (S2) support base.
이 기사와 관련된 일반적인 질문이나 의견이 있으시면 저희 연구팀으로 직접 이메일을 보내주십시오 research_team@ironfx.com
면책 조항:
본 정보는 투자 자문이나 투자 권유가 아닌 마케팅 커뮤니케이션으로 간주해야 합니다.


