

This week optimism returned to energy markets as supply worries were overshadowed by positive sentiment stemming from China’s reopening. Key manufacturing data from China has provided further evidence that the second-largest economy in the world is on track to return to pre-pandemic growth levels, adding more credit to the case for a strong rebound in crude demand. US crude oil inventories on the other hand kept a lid on WTI prices as both API and EIA reports pointed to another week of excess buildups. In this report we aim to shed light on the catalysts driving WTI’s price, assess its future outlook and conclude with a technical analysis.
Chinese manufacturing data bolsters bets for increased crude demand
Earlier this week optimism resurfaced in the energy markets as China’s latest manufacturing data for February pointed to a robust rebound in activity. Prospects for higher demand levels from the top oil-consuming nation henceforth placed firm ground under oil prices and aided to their ascend. According to the latest manufacturing, PMI results from both the Caixin and NBS agencies posted an uptick in activity, more specifically the NBS manufacturing PMI posted better than expected increase in output, rising to 52.6 level beating estimates of 50.5 but also higher than the 50.1 of the prior month. Similarly, the Caixin manufacturing PMI also outperformed forecasts and rose to the 51.5 level, above the expectations for a rise to the 50.2 level, but more importantly rebounding from the prior month’s contraction level of 49.2. Going beyond the manufacturing sector, activity stemming from the services industry of China has also exceeded market expectations and rose to the 56.3 level, above forecasts for a mere rise to the 55.0 level. The overall improvement across industries in the Chinese mainland, validated also from the rise of the Composite PMI metric, stoked optimism for a much stronger rebound from yearlong stagnation and added more confidence to the case for increased oil demand levels from the largest oil consuming nation.
Predictions for stronger growth from China boosts positive sentiment
As we edge closer to China’s National People’s Congress annual legislative meeting, which is set to take place this Sunday, a wide array of bold calls in regards to the nation’s growth trajectory for 2023 become increasingly ambitious. According to an exclusive report from Reuters, Chinese officials’ growth forecasts range between 5% to 6%, with more than half of the sources placing their forecasts near the upper bound of 6%, whereas the rest varying between 5% and 5.5%. Back in November, the consensus expectations for growth in 2023 were modestly placed around the 4.5% to 5.5% range, however the recommendations preceded the abrupt announcement of the abandonment of the strict zero covid policy by the Chinese government in December. Therefore, the rationale behind the optimistic revision of growth projections by officials, most likely entail the prospect of the full-fledged reopening transition which is expected to lift the Chinese economy from its recent underperformance. Analysts 그리고 energy traders therefore are cautiously awaiting for statements from the NPC weeklong summit in regards to economic growth, consumption and employment targets alongside any other possible landmark reforms, that would provide a clearer picture of where China is headed at.
기술적 분석
WTICash 4H Chart
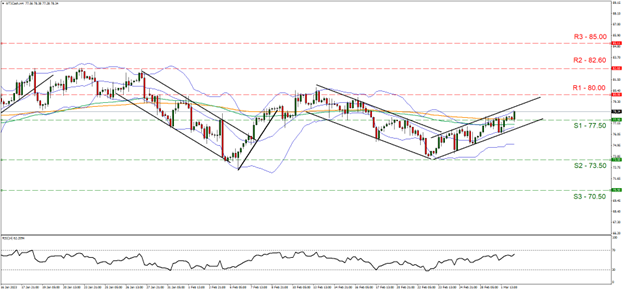
- Support: 77.50 (S1), 73.50 (S2), 70.50 (S3)
- Resistance: 80.00 (R1), 82.60 (R2), 85.00 (R3)
Looking at WTICash 4-hour chart we observe crude trading in an upward facing channel since the 23rd of February, forming higher highs and higher lows and crawls closer to the $80 key psychological resistance level. We hold a bullish outlook bias for crude given its upward trajectory and supporting our case is the RSI indicator below our 4-hour chart which currently registers a reading of 65, showcasing bullish tendencies surrounding the commodity. Furthermore, we would like to note that the price action has today broken above the 100 and 200 period 이동 평균 which could be another signal for an extension towards the upside. Likewise, price action has been flirting with the upper bound of the Bollinger band for the past few days which indicates the desire from the bulls to drive crude’s price higher. Should the bulls reign, we may see WTI break above the 80.00 (R1) resistance level and head closer to the crucial 82.60 (R2) resistance barrier. Should on the other hand, the bears take over, we may see the price action reverse course and break below the 77.50 (S1) support level and head decisively lower closer to the 73.50 (S2) support base.
이 기사와 관련된 일반적인 질문이나 의견이 있으시면 저희 연구팀으로 직접 이메일을 보내주십시오 research_team@ironfx.com
면책 조항:
본 자료는 투자 권유가 아니며 정보 전달의 목적이므로 참조만 하시기 바랍니다. IronFX는 본 자료 내에서 제 3자가 이용하거나 링크를 연결한 데이터 또는 정보에 대해 책임이 없습니다.


