
Oil prices continued their decline for a third week in a row, dropping below the $80 per barrel. In this report, we aim to shed light on the factors driving WTI’s price over the past week, assess its future outlook, and conclude with a technical analysis of WTI.
Oil: Overview Report
API’s oil stockpile increases dramatically
Making a start with the Baker Hughes report which showed that the number of active US oil drills has decreased, placing an end to three weeks of increases. The reduction in active oil drills may be an indication of reduced demand, as was apparent by the API report released this week. The API report, came in much higher than expected, with an increase of 11.9 million barrels of US oil inventories, marking a significant reduction in demand for oil on a weekly basis and as such could continue weighing on the price of oil, should the inventories continue increasing, implying a slack in the US oil market.
However, we would like to note that the EIA will be delaying its scheduled data releases from November 8th to 10th and will resume its regular schedule on November 13 . As such traders, may be anticipating the EIA report to echo the increase in inventories, as was shown by the API inventories, which could further weigh on the price of oil. Whilst, should they contradict the API’s figures, we may see temporary support for oil prices.
Saudi Arabia and Russia to continue oil production cuts until December
This past Sunday, Saudi Arabia and Russia reaffirmed their intentions to continue with their oil output cuts until the end of the year, as demand and economic growth concerns continue to mount on a global level. According to Reuters, the two countries will be reviewing their oil production cuts next month and will be discussing, whether or not to extend or even deepen oil production cuts for the future. Should they decide to maintain the current tightness of the supply side of the commodity or even intensify it, we may see an increase in the price of oil, as supply constraints increase.
However, we believe that further production cuts may be counterproductive to Saudi Arabia’s aims and could have a negative effect on its oil revenue. As such, should the two nations decide to end their agreement or increase their oil production, we may see an easing of pressures on the oil markets and as such, it may push oil prices to lower ground.
China’s Economic woes continue
The release of China’s CPI rates were indicative that the economy has once again entered a deflationary period, sparking worries about the resilience of the Chinese economy. Furthermore, China’s trade data came in this week and confirmed concerns about the Chinese manufacturing industry, as the exports rate came in at -6.4% lower than expected. The financial releases continued to highlight how the Chinese economy continues to struggle and heightened worries in oil market participants for a possible slowing of oil demand in the manufacturing giant.
Overall, should China’s recovery efforts continue to underwhelm market participants, we may see the growing concerns about China’s economic resilience, exerting a bearish effect on oil prices.
The Israeli conflict
The situation in the Middle East remains tense yet talks about a potential humanitarian corridor appear to have intensified since last week. As such, should further inroads be made in regards to international cooperation on a humanitarian level at least, we may see market worries of a wider regional conflict easing, which may weigh on the price of oil as market worries for the supply side of oil may subside. Nevertheless, as we stated last week the situation is still considered as being dynamic and should any unexpected developments occur, which may lead to an escalation of hostilities, we may see oil prices being pushed higher.
Yet, we have to note that there is an increased consensus that pauses in fighting must occur in order to allow for the transfer of humanitarian aid into Gaza. The temporary pauses in fighting could ease tensions in the region and as such, may lead to lower oil prices.
Oil: Technical Analysis
WTI Cash H4 Chart
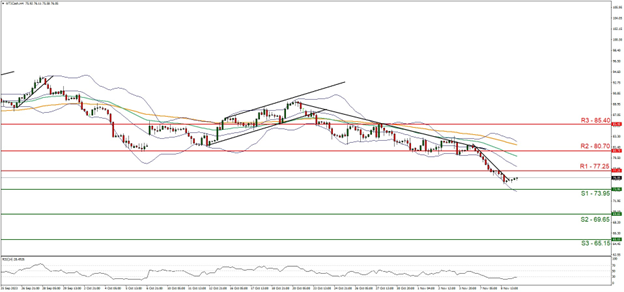
- Support: 73.95 (S1), 69.65 (S2), 65.15 (S3)
- Resistance: 77.25 (R1), 80.70 (R2), 85.40 (R3)
On a technical level, we note the bearish tendencies of WTI since last week’s report appear to have intensified, with the commodity breaking below the $80 key psychological level, at levels not seen since July. The current low level of WTI’s price may cause some hesitation among oil bears, which could lead to some sort of stabilisation. Yet we note that similar signals were sent out last week as well and WTI prices still moved lower.
Hence, we tend to maintain a bearish outlook for the commodity’s price and supporting our case is the RSI indicator below our 4-hour chart which currently registers a figure near 30, implying a strong bearish market sentiment. However, we should note that the commodity was below the 30 RSI figure and as such, the breaking of our downwards moving trendline which was incepted on the 6 of November, may be a temporary market correction to higher ground.
Also, note how WTI’s price corrected higher after flirting with the lower Bollinger band. Thus, should bears maintain control over the commodity’s price action, as expected, we may see a break below the 73.95 (S1) support level, with the next possible target for the bears being the 69.65 (S2) support base. On the other hand, for a bullish outlook, we would like to see a clear break above the 77.25 (R1) resistance level if not breaking even above the 80.70 (R2) resistance line, with the next possible target for the bulls being set at the 85.40 (R3) resistance ceiling.
면책 조항:
본 정보는 투자 자문이나 투자 권유가 아닌 마케팅 커뮤니케이션으로 간주해야 합니다.


