
WTI edged higher yesterday, yet overall the sideways movement around the $79 axis seems to remain unchanged. Issues troubling oil traders over the past few days have been among others the release of part of the American Strategic Petroleum Reserve, the production cuts of Russia, the surpluses recorded in the US oil market and the oil demand outlook of China but also on a global level. In this report we aim to shed light on the catalysts driving WTI’s price, assess its future outlook and conclude with a technical analysis on a daily level to get a wider picture of the movement of the commodity’s price.
Data in the US oil market this week
We make a start with the weekly data related to the US oil market. Last Friday we had the Baker Hughes US oil rig count, which showed that the number of active oil rigs rose by 10. The rise was notable as it ended a 4-week period of continuous drops. The release tended to imply an increase of demand as oil producers were forced to reactivate a number of oil rigs yet Tuesday’s API weekly crude oil inventories release created the first doubt about the US oil market as it recorded a rise of 10 million barrels in US oil inventories. The slack recorded in the US oil market was confirmed also by the release of the EIA crude oil inventories figure on Wednesday, as it recorded an even wider rise of oil inventories, this time of 16 million barrels which tended to intensify market worries for the supply side surpassing demand levels in the US oil market.
IEA raises oil demand growth expectations for 2023
Yet market worries for the slack in the US oil market eased, even partially were reversed as the International Energy Agency raised its expectations for global oil demand in 2023 to 2 million barrels per day (bpd), with the rise being of about 100k bpd. The rise seems to be related to the reopening of China, and its characteristic, that IEA was reported stating that “The risk-averse climate of recent months subsided on optimism that China’s reopening would bolster global growth. Adding to the more upbeat mood was a distinct improvement in Europe’s economic outlook, buttressed by the spectacular slump in natural gas prices,”. At the same time, the Agency raised also its supply growth estimate by 200k bpd to 1.2 million bpd, with countries outside of OPEC, such as Brazil, the US, Norway and Canada, expected to be the main suppliers. But still, the demand side seems currently to outweigh the supply side, thus the market in the longer term may be threatened by a bottleneck, which could push oil prices higher.
US releases 26 million barrels of oil from SPR
As reported by Reuters and other media on Monday, the US Government announced that it is selling 26 million barrels of crude oil from the Strategic Petroleum Reserve (SPR), a release that had been decided by the US Congress in previous years. The oil is to be delivered fromApril 1st to June 30 covering a part of the demand. Yet the release may boost the supply of oil yet it is considered rather limited if compared to prior years and may have a limited effect on the oil market but nevertheless is considered as another boost of the production side of the commodity and tended to weigh a bit on oil’s price.
Russia to cut production by 500k bpd
As reported by Reuters, Russia stated that it will cut production of oil by 500k bpd in March, as announced by Deputy Minister Alexander Novak, as a response to the West imposing a price cap on Russian oil and oil products. The G7, the European Union and Australia agreed to ban the use of Western-supplied maritime insurance, finance and brokering for seaborne Russian oil priced above $60 per barrel.
Overall, analysts tend to highlight the possibility that OPEC members may not be willing to compensate with increased production levels for the shortfall to be created in oil supply by Russia’s decision, which further highlights the role that the US and other non OPEC oil producing countries have.
기술적 분석
WTI Cash Daily Chart
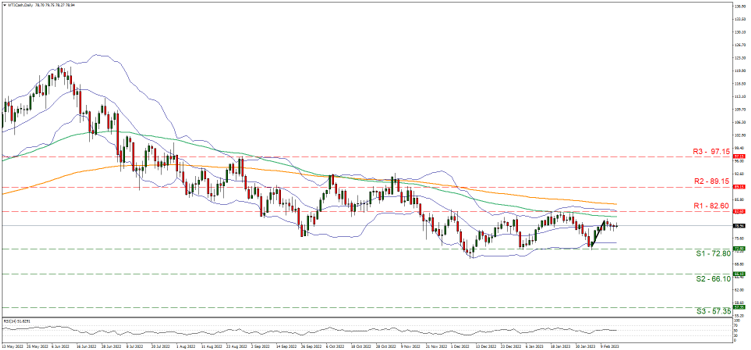
Support: 72.80 (S1), 66.10 (S2), 57.35 (S3)
Resistance: 82.60 (R1), 89.30 (R2), 97.15 (R3)
We decided to have a wider look at WTIs’ price action, thus we present its’ Daily chart, recalibrating its support and resistance lines. We note that the commodity’s price maintained a sideways motion between the 82.60 (R1) resistance line and the 72.80 (S1) support level, since the 18 of January, with the range bound movement narrowing dramatically in the past week. Given also that the RSI indicator runs along the reading of 50, implying a rather indecisive market and the flattening of the Bollinger bands we tend to maintain our bias for the wide sideways motion between the prementioned levels for now. Should the bulls take over we may see the commodity’s price action breaking the 82.50 (R1) resistance line, in which case the way would be paved for the 89.15 (R2) resistance level. Should the bears take over, we may see the commodity’s prices, breaking the 72.80 (S1) support line, with the next possible stop for the bears being the 66.10 (S2) support barrier.
이 기사와 관련된 일반적인 질문이나 의견이 있으시면 저희 연구팀으로 직접 이메일을 보내주십시오 research_team@ironfx.com
면책 조항:
본 자료는 투자 권유가 아니며 정보 전달의 목적이므로 참조만 하시기 바랍니다. IronFX는 본 자료 내에서 제 3자가 이용하거나 링크를 연결한 데이터 또는 정보에 대해 책임이 없습니다.


