

Oil prices seem to have halted their freefall mentioned in last week’s report and stabilised for the time being, yet the stabilisation is still being characterised by a relative uneasiness. In todays’ report we are to have a look at fundamental issues guiding wti prices, such as the state of the US wti market, OPEC+’s meeting and oil demand. For a rounder view we are to provide also a technical analysis of WTI’s daily chart.
US wti market tightens supporting oil prices
On Tuesday though we got a different picture as API reported another drawdown in US wti inventories, narrower than the prior week, but still, the reduction of US wti inventories by almost four and a half million barrels, highlights how oil production levels failed to catch up with aggregated oil demand in the US, which in turn implies a relative tightness of the US oil market which is supportive for wti prices.
OPEC+’s stunts markets with wti production hike
OPEC+’s meeting stunned the markets over the last weekend as OPEC+ agreed to an oil production surge in June. The oil production cartel agreed to boost production by 411k barrels per day, in the coming month, June.
The oil production hike is concentrating with Saudi Arabia expected to reach a production of 9,367kbd, Russia to 9,161kbd, Iraq to 4,086kbd, UAE to 3,092kbd, Kuwait to 2,466kbd, Kazakhstan to 1,500kbd, Algeria to 928kbd and Oman to 775kbd. Gradual increases as per OPEC’s announcement may be paused or reversed depending on the evolving market conditions.
The news dealt a hit on oil prices as Brent dropped temporarily below $60 per barrel and WTI neared $55 per barrel. Overall the prospect of a substantial increase of oil supply, continues to constitute a bearish factor for oil prices. Should we see such signals intensifying in the coming week, we may see oil prices retreating further.
Oil demand outlook may improve supporting oil prices
In an examination of the demand sign of the international oil market, we note that analysts are highlighting signs of increased demand from Europe and China.
Overall a potential improvement of economic activity in the two areas, especially in the manufacturing sector could be considered as a forerunner for a rise of oil prices. Also we note the possibility of an easing of the trading tensions, given Trump’s tariffs.
The US President has stated that he is to announce a major trade deal in the coming days. Such news could ease market worries and improve the outlook of oil demand. It’s characteristic that market expectations for a possible US-Sino trade deal intensified.
As Per Reuters, U.S. Treasury Secretary Scott Bessent and chief trade negotiator Jamieson Greer will meet top Chinese economic official He Lifeng in Switzerland this weekend for talks.
Should the market’s hopes for a possible trade deal between China and the US intensify further we may see them having a bullish effect on oil prices.
Oil Technical Analysis
WTI Cash Daily Chart
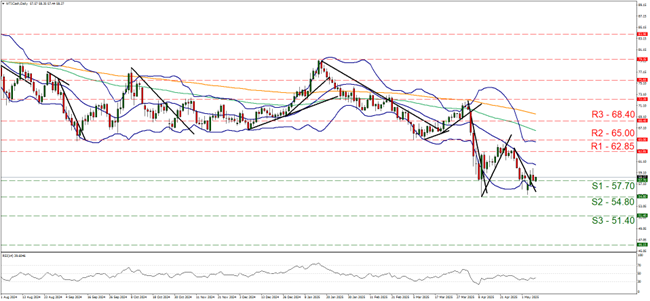
- Support: 57.70 (S1), 54.80 (S2), 51.40 (S3
- Resistance: 62.85 (R1), 65.00 (R2), 68.40 (R3)
WTI’s price action continued to test 57.70 (S1) support line yesterday and during today’s Asian session. Given the temporary breaking of the S1 line on Monday, we see the case for the commodity’s price to maintain a sideways motion around the 57.70 (S1) support line.
We should note though that the RSI indicator remained between the readings of 30 and 50 implying a bearish predisposition of the market for the commodity’s price.
Should the bears take over, we may see WTI’s price breaking the 57.70 (S1) support line. It could then continue to break the 54.80 (S2) support level. The next possible target would be the 51.40 (S3) support barrier.
Should the bulls take over, we may see WTI’s price action rising and breaking the 62.85 (R1) resistance line. It could then start aiming for the 65.00 (R2) resistance level.
면책 조항:
고지 사항: 본 정보는 투자 자문이나 투자 권유가 아닌 마케팅 커뮤니케이션으로 간주해야 합니다.


