
Since our last report ,Oil prices continued their downward motion for a fourth week in a row, despite an upward correction at the beginning of the week. Today we are to take a look at the state of the US oil market as well as other fundamental issues affecting the demand and the supply side of the international oil market. For a rounder view, we are to conclude the report with a technical analysis of WTI’s daily chart.
Mixed signals in the US oil market
We make a start with the situation of the US oil market. On Friday, the release of the US Baker Hughes total rig count, showed that the number of active oil rigs, continued its increase, by rising to 480 from 479.
The release tended to imply a continuation of bullish signals for oil prices as it could imply that demand continues to be on the rise which may have forced oil producers to activate even more oil rigs.
Yet the idea of a tightening US oil market was once again contradicted on Tuesday as the API weekly crude oil inventories figure showcased a significant increase of 9.043 million barrels, a figure even higher than last week’s figure of 5.025 million barrels and even higher than the expected figure of 2.8 million barrels.
The release highlighted how aggregated oil production surpassed oil demand levels once again, implying a slack in demand from the US oil market over the past week.
A similar picture was shown also by the release of the weekly EIA crude oil inventories which showed an even wider increase of oil reserves in the US, of 4.070 million barrels a figure that was also wider than the expected figure of 2.4 million. The continued increase in crude oil inventories could potentially weigh on crude oil prices should a similar picture emerge next week.
Ukraine peace deal in the works?
US President Trump stated according to Reuters, that both Russian President Putin and Ukrainian President Zelensky during separate phone calls expressed a desire for peace between the two nations. Specifically, President Trump in a truth social post earlier on today stated that he had “Great talks with Russia and Ukraine yesterday.
Good possibility of ending that horrible, very bloody war”. Moreover, Trump has ordered US officials to begin talks in regards to ending the war in Ukraine, with Defence Secretary Hegseth stating that Ukraine should not be hoping for a return to its pre-2014 borders.
Overall, it appears that the new US administration is pressuring both sides to come to the table in order to find an amicable solution that may bring an end to the war. In turn, the implications of the war coming to an end, may also mean that the sanctions on Russia and in particular the sanctions on oil.
Hence the possibility of a lifting of sanctions could allow Russia’s oil exports to increase and thus with supply potentially exceeding demand, it could weigh on oil prices. However, the situation is uncertain and the degree upon which an agreement can be made is still very speculative.
In our opinion, we are not surprised to see the Trump administration pushing both sides to the negotiating table in an attempt to end the war, yet until we see a peace agreement being signed, we remain skeptical.
Oil Technical Analysis
WTI Cash Daily Chart
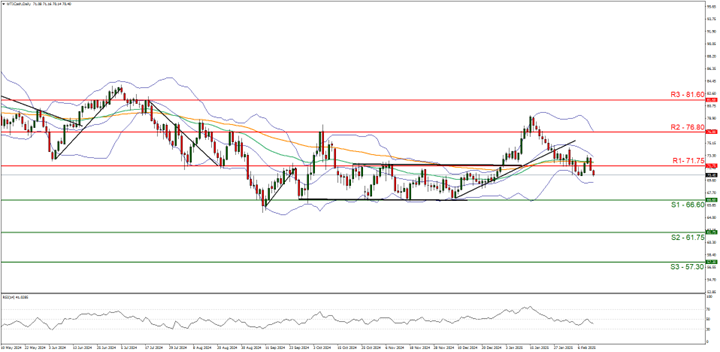
- Support: 66.60 (S1), 61.75 (S2), 57.30 (S3)
- Resistance: 71.75 (R1), 76.80 (R2), 81.60 (R3)
WTI’s downwards appears to be continuing for a fourth week in a row. We opt for a bearish outlook for the commodity’s price and supporting our case is the break below our support now turned to resistance at the 71.75 (R1) level, in addition to the RSI indicator below our chart which currently registers a figure near 40, implying a bearish market sentiment.
For our bearish outlook to continue, we would require a break below the 66.60 (S1) support level, with the next possible target for the bears being the 61.75 (S2) support line.
On the flip side, for a sideways bias we would require the commodity’s price to remain confined between the 66.60 (S1) support level and the 71.75 (R1) resistance line. Lastly, for a bullish outlook, we would require a clear break above the 71.75 (R1) resistance level, with the next
면책 조항:
고지 사항: 본 정보는 투자 자문이나 투자 권유가 아닌 마케팅 커뮤니케이션으로 간주해야 합니다.


