
The upward movement of gold’s price appears to have been halted, with the precious moving to lower ground, as market traders await the Fed’s interest rate decision. The continued strengthening of the greenback appears to have capped Gold’s gains. In this report, we aim to shed light on the catalysts driving gold’s price, assess its future outlook and conclude with a technical analysis.
Market anticipations of the Fed’s interest rate appear to be weighing on the precious.
Market participants, appear to be eagerly awaiting the Fed’s which is due to be released tomorrow, following last weeks initial Jobless claims figure, which indicated that the US labour market remains tight, following a lower than expected figure of 228k compared to the predicted figure of 242k. The lower than expected figure, may have potentially provided some leeway for the Fed, should they decide to increase interest rates in their meeting tomorrow, given that tight labour market could add to inflationary pressures. Furthermore, the better-than-expected S&P Preliminary Manufacturing figure for July, was indicative of the manufacturing sector contracting, but at a slower rate, in addition to FFF implying a 97.2% for the Fed to hike by 25 basis points, appears to be supporting the dollar. The positive financial releases, could be weighing on golds price, given that the two maintain an inverse relationship, and thus the greenbacks rise could be attributed to gold’s move to lower ground. However, the current economic situation in the US could weaken the greenback, as despite some positive financial releases the long-term macroeconomic outlook, could be perceived as a negative for the US economy. Therefore, we may see the precious metal moving in an upwards direction in the long run.
Newcrest’s gold output rises.
Newcrest on Tuesday released its Q4 FY23 report, which confirmed that the company had achieved its FY23 gold production. The company was able to alleviate production snags at its flagship Cadia mine in New South Wales, allowing for the mining facility to reach prior production levels, as the mine was able to increase production by nearly 14%. In the event that production keeps increasing, we may see an increase in supply of gold into the market which could theoretically drive the precious 금속 price downwards. Furthermore, should that be the case, we may see the price of gold declining, yet given geo–political 이벤트 / 사건, such as a gradual de–dollarization, we might see potential increases in supply being snatched up by Governments, in an attempt to reduce their reliance on the dollar. Furthermore, we should note that Newcrest is to be acquired by Newmont, with the deal pending shareholder approval, thus potentially benefitting Newmont as well.
North America regains its gold taste?
According to data from Gold.org, North America in the week ending 21st July has switched its Gold ETF flows, from negative to positive. Since the 26 of May, gold demand in North America has been graduallydeclining, yet last week thatchanged. North American Gold ETF’s demanded approximately 4.9 Tons of Gold, ending an almost 1-month recorded decline in demand. It could be chalked up to increasingfears of a recession the US,UK and China , as the rhetoric surrounding a potentialrecession appears to be ramping up from traditionalnewsoutlets. Therefore, given Gold’sstatus, as a hedge during times of uncertainty, we may see this renewed interest in the precious, providingsupport for Gold’s price in the short–term.
기술적 분석
XAUUSD H4 Chart
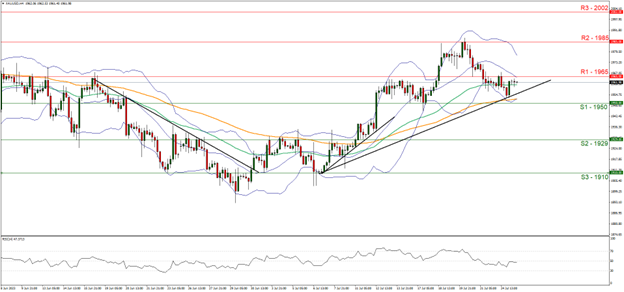
- Support: 1950 (S1), 1929 (S2), 1910 (S3)
- Resistance: 1963 (R1), 1993 (R2), 2021(R3)
On a technical level we note despite gold breaking below support turned resistance at the 1965 (R1) level, it continues to validate our upwards moving trendline. We continue to maintain a bullish outlook for gold’s price and supporting our case is the aforementioned trendline, formed on the 7 of July. For our bullish outlook to continue, we would like to see the precious continue to validate our upwards trendline, combined with a clear break above the 1965 (R1) and 1985 (R2) resistance lines, with the next possible target for the bulls being the 2002 (R3) resistance ceiling.
On the other hand, for a bearish outlook, we would like to see a clear break below the aforementioned upwards trendline, combined with a clear break below the 1950 (S1) support level, with the next possible target for the bears being the 1929 (S2) support base. However, we should note that the RSI below our 4-Hour chart is currently registering a figure near 50, which may imply a neutral market sentiment. As such, for a neutral outlook we would like to see the precious remaining between the 1950 (S1) and 1965 (R1) support 그리고 resistance levels, respectively. Lastly, the Fed’s interest rate decision tomorrow, could lead to volatile price swings in either direction.
면책 조항:
본 정보는 투자 자문이나 투자 권유가 아닌 마케팅 커뮤니케이션으로 간주해야 합니다.


