
Gold at the time of this report, seems to be moving in a sideways fashion, following its ascent during last week. We note that external shocks in the gold market appear to be fading, yet financial releases stemming from the US and in particular last week’s CPI print, appear to be strengthening the negative correlation between the dollar and the precious metal, which had faded in the past month. In this report, we aim to shed light on the catalysts driving gold’s price, assess its future outlook, and conclude with a technical analysis.
Gold Market Report
US CPI rates aid Gold’s ascent
The CPI rates for the US which were released last Tuesday, were indicative of easing inflationary pressures in the US economy. The assumption that inflationary pressures may be easing, appears to have enhanced the anticipation of market participants that the Fed has reached its terminal rate and will remain on hold. As such, with the reduction in market expectations of another hike by the Fed, the dollar appears to have weakened, thus given the apparent inverse relationship between the dollar and the precious metal, it may have facilitated gold’s ascent during the past week.
Furthermore, the market anticipation that the Fed may be done with raising interest rates, seems to have also impacted the US Bond markets, where lower future interest rates, may be reducing the bond yield’s appeal to investors. Therefore, given their inverse relationship with gold, the reduction in US Yields may be facilitating the transfer of funds into the precious metal.
US Financial releases to lead the way
This week, is expected to have numerous financial releases from the US which could dictate the greenback’s direction and by default, the direction of the precious metal. Starting off with the FOMC meeting minutes tomorrow, traders may be eager to see if the Fed has left clues in its meeting minutes, as to whether or not they are done with raising interest rates. In such a scenario, we may see the dollar weakening, whilst gold may capitalize on dollar weakness and move higher, as it may be more appealing to investors. Whereas should the minutes indicate that the Fed may not be done with raising interest rates, we may see the dollar strengthening, and as a result, we may see the precious aiming for lower ground, given their inverse relationship. In our opinion, the lower-than-expected CPI print last week may have led to a relatively dovish undertone by Fed policymakers, yet we remain vigilant about potential surprises about another rate hike in the meeting minutes.
On another note, we highlight the release of US Preliminary S&P PMI figure for November, which is expected by market participants to indicate that the US manufacturing industry has contracted, yet with the holiday season around the corner, we believe that the data may be influenced in a positive manner. As such, we believe that the S&P Preliminary manufacturing figures, may come in slightly higher than expected and take the markets by surprise, in which case the dollar may gain support, whilst the precious metal weakens. In conclusion, we remain vigilant about potential surprises which could strengthen the dollar during the week and as a result, weaken the precious metal due to their inverse relationship.
Gold – Technical Analysis
XAUUSD 4-Hour Chart
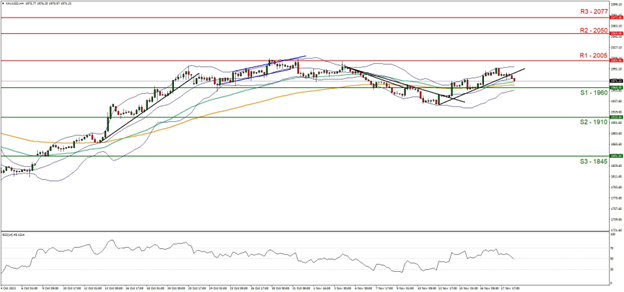
- Support: 1960 (S1), 1910 (S2), 1845 (S3)
- Resistance: 2005 (R1), 2050 (R2), 2077 (R3)
Since our last report, gold’s price appears to have moved in an upward fashion, having broken above resistance now turned support at the 1960 (S1) support level. We switch from last week’s bearish outlook to a sideways bias for the precious metal for the time being, and supporting our case is the RSI indicator below our 4-hour chart currently running along the figure of 50, implying an indecisive market sentiment, in addition to the breaking below the upwards moving trendline which was formed on the 13 of November.
Furthermore, the flatting of the Bollinger bands, which imply low market volatility, could further support our sideways bias for the precious metal. For our sideways bias to continue, we would like to see gold remaining between the 1960 (S1) support level and the 2005 (R1) resistance level.
On the flip side, for a bearish outlook, we would require to see a clear break below the 1960 (S1) support level, with the next possible target for the bears being the 1910 (S2) support base. Lastly, for a bullish outlook, we would like to see a break above the 2005 (R1) resistance level, with the next possible target for the bulls being the 2050 (R2) resistance ceiling.
면책 조항:
본 정보는 투자 자문이나 투자 권유가 아닌 마케팅 커뮤니케이션으로 간주해야 합니다.


