
Gold’s price appears to have stabilised in the past week, since our last report , after experiencing some safe haven outflows last Monday yet monetary policy events and financial releases that could affect the direction of its price action may be just around the corner.
Today we are to discuss the fundamental challenges laid ahead for the precious metal as well as monetary policy events and financial releases that could affect the direction of its price action. Finally, we will be concluding this report with a technical analysis of gold’s daily chart.
Negative correlation of USD and gold not in place
The classic perception of the market for a negative correlation between the USD and gold’s price seems not to be in place over the past ten days. Gold’s price lost considerable ground while in the same period, the USD edged also lower.
Yet we expect the negative correlation of the two trading instruments to be on display once again, possibly in the coming week as safe haven flows seem to be easing.
It should be noted that at the same timeframe and despite a relative rollercoaster ride, US yields seem to have remained near the same levels. Hence we still see the case for the antagonistic relationship between gold’s price and US bonds as safe haven instruments to have been inactive.
Nevertheless, should US yields start rising substantially we may see trader’s attention turning towards US bonds as gold is non-interest bearing and actually also has storage costs, thus weighing on gold’s price.
Overall we expect financial releases and monetary policy events to have a substantial impact on the prementioned factors.
The Fed’s interest rate decision
On Friday, the PCE price index for March, both on a headline as well as on a core level, failed to slow down, implying a persistence of inflationary pressures in the US economy.
The release may add pressure on the Fed to maintain a more hawkish stance, while the market may start to reposition itself ahead of the Fed’s interest rate decision on Wednesday. The bank is widely expected to remain on hold and currently, Fed Fund Futures (FFF) imply a probability of 97.9% for such a scenario to materialise.
Hence we expect the market’s attention to turn towards the accompanying statement and Fed Chairman Powell’s press conference for any clues regarding the bank’s future intentions. It should be noted that FFF also imply that the market expects the bank to start cutting rates in the September meeting.
Yet inflation seems to be sticky and may be adding pressure on the bank to maintain rates high for longer. Should the bank’s forward guidance imply a possible delay of any rate cuts we may see the market’s expectations being contradicted and the USD getting some support.
At the same time, a possible strengthening of the greenback, could have a bearish effect on gold’s price.
March’s US employment report
The second market-moving event this week for gold, is expected to be the release of the US employment report for April on Friday.
Overall forecasts are for the NFP figure to drop and the unemployment rate to rise, implying an easing of the US employment market that may in turn ease the hawkishness of the Fed and thus support gold’s price.
Yet there is a wide degree of uncertainty regarding the actual release, as the rates and figures of the report took the markets by surprise a number of times in the past months and should the US employment market prove to be more resilient than forecasted, we may see it weighing on gold’s price.
기술적 분석
XAUUSD Daily Chart
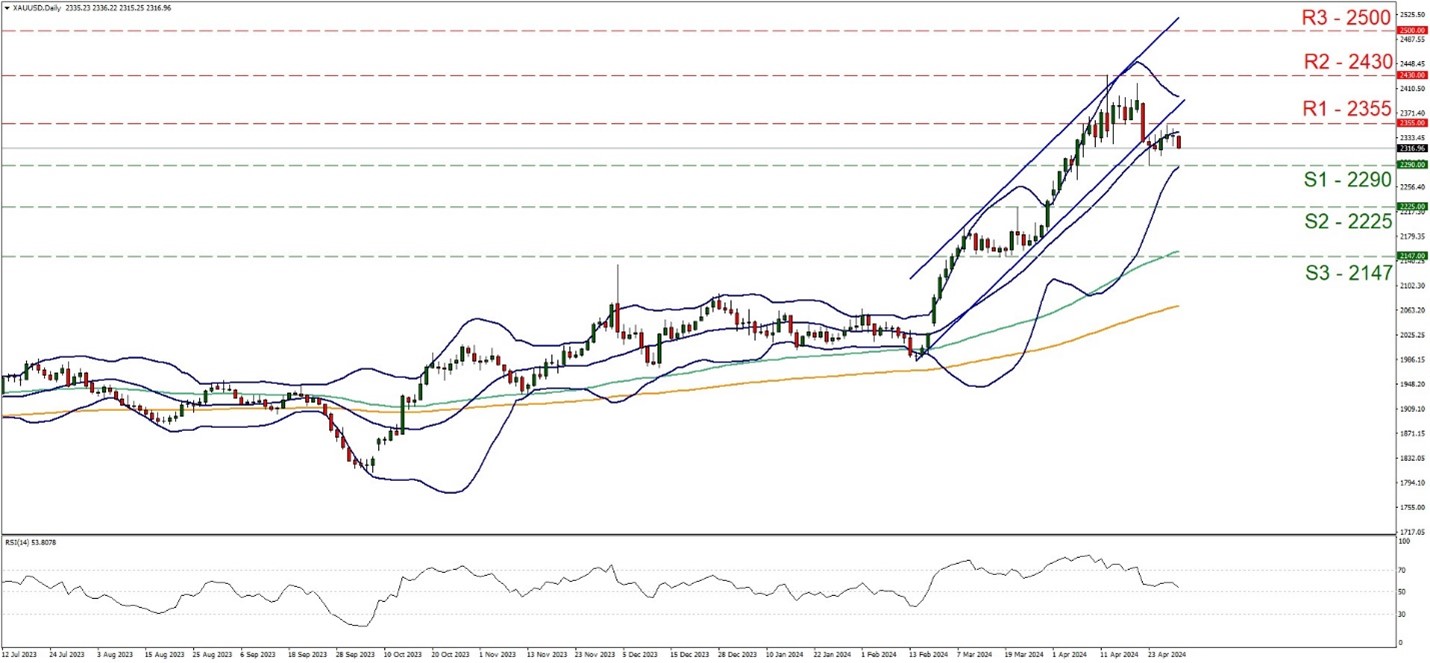
- Support: 2290 (S1), 2225 (S2), 2147 (S3)
- Resistance: 2355 (R1), 2430 (R2), 2500 (R3)
On a technical level, Gold’s price tended to stabilise since our last report, confining its price action between the 2290 (S1) support line and the 2355 (R1) resistance line.
Based on the precious metal’s price action over the past week, and given the clear breaking of the lower boundary of the upward channel last Tuesday, that used to guide gold’s price, we tend to maintain a bias for the sideways motion to continue within the boundaries set by gold’s price action in the past week.
Yet we also note that the RSI indicator is running just above the reading of 50, implying a rather indecisive market which also seems to be underscoring a sideways motion.
Furthermore, the Bollinger bands seem to be converging implying lower volatility for gold’s price, which also could allow the sideways motion to be maintained. Should the bears find a chance to take over the reins over gold’s direction, we may see it breaking the 2290 (S1) support line and start aiming for the 2225 (S2) support level, while should the bears prove to be more persistent and drive gold’s price even lower we note the 2147 (S3) support base.
On the flip side, should the bulls be in charge of gold’s direction, we may see the precious metal’s price breaking the 2355 (R1) resistance line and start aiming for the 2430 (R2) resistance level, which is also an all-time high for the precious metal’s price. While should the R2 be broken we set the 2500 (R3) as the next possible target for gold bulls.
면책 조항:
본 정보는 투자 자문이나 투자 권유가 아닌 마케팅 커뮤니케이션으로 간주해야 합니다.


