
Gold’s price moved higher over the past week, reaching a new record-high level. In today’s report, we intend to lay out the main fundamental challenges ahead for the precious metal, including the negative correlation of the USD with gold’s price as well as the upcoming release of the Fed’s interest rate decision tomorrow. We will be concluding this report with a technical analysis of gold’s daily chart.
USD’s negative correlation with gold continues to be inactive
The negative correlation of the USD with gold’s price seems to have been in place yet blurred somewhat. The USD remained relatively unchanged in the last week, yet gold’s price got substantial support. On the flip side, on Monday and during today’s Asian session the USD edged lower, while gold’s price failed to benefit from it.
A factor that may have provided support for Gold’s price may have been the drop of US yields both for short term and long term bonds. It’s characteristic that the drop of US yields started last Thursday while gold’s price started to rise on the same day.
Hence the negative correlation of US bond yields and gold’s price is in place, given also that the US bonds and gold tend to maintain an antagonistic relationship. Should US yields continue falling, it could ease the attractiveness of US bonds as a safe haven trading instrument and polish the shiny metal’s appeal further, despite being non-interest bearing.
The Fed’s interest rate decision
In the coming week the main event for Gold’s price may be the release of the Fed’s interest rate decision on Wednesday. The bank is widely expected to cut rates what remains to be seen is to which degree the interest rate is to be reduced. The market seems to be currently pricing in a 50 basis points (bp) rate cut by 67% according to Fed Fund Futures (FFF), while the other 33% implies that a 25 bp rate cut is also sufficient.
Yet FFF also implies that the market expects further lowering of 75 bp of the Fed’s interest rate by the end of the year. Hence the dovish expectations of the market are intense and imply that not only the width of a possible rate cut by the bank is important, but also the bank’s further intentions.
Should the bank actually deliver a 50 bp rate cut as expected we may see gold’s price gaining some support, while a 25 bp rate cut would contradict market expectations and could weigh substantially on gold’s price. As for the Fed’s intentions we highlight four elements.
The first would be the bank’s forward guidance, included in the accompanying statement. Should the document be characterised by a clear cut dovish tone, thus verifying the market’s expectations, we may see gold’s price getting some support and vice versa.
The second would be the new dot plot, showing the expectations of Fed policymakers about where interest rates are to land by the end of the year, the next year, the year after that and beyond. Should Fed policymakers show that they expect the interest rate to land higher than what the market expects we may see gold’s price falling.
The third element of interest for market participants, may be the bank’s macroeconomic projections. Should we see a more optimistic outlook for the US economy, supporting the scenario of a soft landing and CPI rates easing further we may see gold’s price edging higher. Last but not least, we highlight Fed Chairman Powell’s press conference half an hour after the release of the Fed’s interest rate decision.
Should the Fed Chairman maintain a clearcut dovish tone in his press conference we may see gold prices getting some support, while any hesitation contradicting the market’s expectations for extensive rate cuts to come could weigh on gold’s price.
Upcoming Financial releases
Besides the today’s US retail sales and industrial output growth rates for August and the Fed’s interest rate decision tomorrow, we may see other financial releases over next days affecting gold’s price. We note on Thursday, the release of the Philly Fed Business index for September. We note that the sister indicator, the New York Fed Manufacturing index for the same month indicated a substantial expansion of economic activity in the wider New York area.
Should we see the Philly Fed Business index on Thursday, also implying similar expansion of economic activity we may see gold’s price slipping. Another interesting release would the US consumer confidence indicator for September next Tuesday showing a more optimistic outlook on behalf of the average US consumer we may see it weighing on gold’s price.
Gold Technical Analysis
XAUUSD Daily Chart
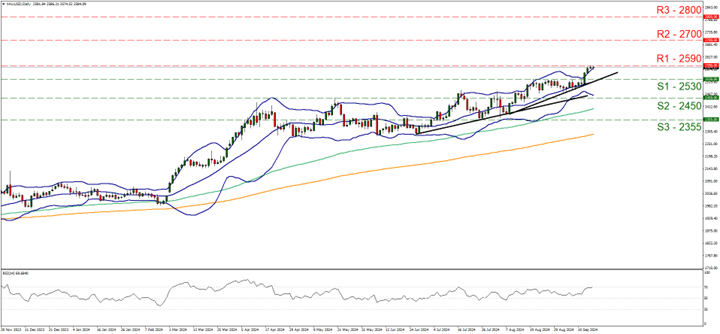
- Support: 2530 (S1), 2450 (S2), 2335 (S3)
- Resistance: 2590 (R1), 2700 (R2), 2800 (R3)
Gold’s price seems to have hit a ceiling at the 2590 (R1) resistance line, which is a new record-high for the precious metal’s price. We tend to maintain a bullish outlook given that the upward trendline guiding gold’s price since the 8 of August, remains intact. We also note that the RSI indicator has reached the reading of 70, implying a strong bullish market sentiment for gold.
On the flip side the fact that the RSI indicator has reached the reading of 70, may imply that the precious metal’s price may be nearing overbought levels and may be ripe for a correction lower. At the same time, we note that the price action of the bullion has reached a halt after breaching the upper Bollinger Band also implying that gold’s price may have reached overbought levels and may force gold bulls to take a break. Should the buying interest be extended as expected, we may see the bulls pushing the precious metal’s price beyond the 2590 (R1) resistance line and set as the next possible target for gold bulls, the 2700 (R2) resistance level. Yet a bullish outlook would imply entering unchartered waters, which may cause gold bulls cold feet.
A bearish outlook seems currently remote and for it to materialise the price action of gold may have to drop and initially break the prementioned upward trendline in a first signal that the upward motion has been interrupted and continue to break the 2530 (S1) support line and start actively aiming for the 2450 (S2) support level.
면책 조항:
고지 사항: 본 정보는 투자 자문이나 투자 권유가 아닌 마케팅 커뮤니케이션으로 간주해야 합니다.


