
Since our last report, Gold’s upward direction was maintained on Monday, with the bullion forming a fresh all-time high. In today’s report, we are to discuss the possible implications of Trump’s possible implementation of tariffs on Canada and Mexico and discuss the possible implications of the release of the US Core PCE rates on Friday. For a rounder view, we will conclude the report with a technical analysis of gold’s four-hour chart.
Trump tariff plans to proceed?
According to a recent report by Bloomberg, President Trump has been quoted as saying that the tariffs “are going forward on time, on schedule” with an implied date being the 4 of March implying that the US administration may be moving forward with the tariffs on Mexico and Canada.
The tariffs would see a 25% levy on Canadian and Mexican imports to the US which were meant to be implemented last month but were postponed after pledges by Prime Minister Trudeau and Mexican President Sheinbaum to boost their border-policing efforts.
The possibility of tariffs coming into effect on March 4 , may be of concern as it could lead to retaliatory measures by Mexico and Canada, a scenario we have previously discussed in our reports. Thus, the possibility of trade wars now having resurfaced, market participants may be concerned about the potential impact on the global economy and more specifically the US economy.
Moreover, the US is considering the imposition of tougher versions of US semiconductor curbs on China’s chip industry in a possible attempt to curtail China’s technological progress. Hence, should China retaliate against the US, it may spark a trade war between the two economic behemoths which may increase volatility in the markets. In turn, the increased tensions as a result of America’s desire and willingness to impose tariffs, could be aiding the precious metal’s price, given its status as a safe haven asset.
However, it should be noted that a US official per Bloomberg said that the fate of the special 25% levy on Canada 그리고 Mexico was still to be determined. Nonetheless, should the US proceed with the implementation of tariffs as promised, it may increase concerns about a potential trade war and retaliatory measures from the affected countries, which may aid gold’s price.
On the other hand, should we see a postponement of the imposition of tariffs, it may alleviate some concerns and could potentially weigh on gold’s price.
US Financial releases
The US Core PCE rates for January are set to be released this Friday. The Core PCE rates are the Fed’s favourite tool for measuring inflationary pressures in the US economy and could thus lead to heightened market volatility during their release.
Economists are currently anticipating an acceleration of the Core PCE rates on a month-on-month basis from 0.2% to 0.3% , whereas on a year-on-year basis the expectation is for the release to showcase easing inflationary pressures with the expected rate being 2.6% which would be lower than the previous release of 2.8%.
Nonetheless, we tend to turn our attention to the Core PCE rate on a year-on-year basis and thus should it come in as expected or lower, which may imply easing inflationary pressures in the US economy it could increase pressure on the Fed to resume on their rate-cutting path which could weigh on the dollar whilst aiding gold’s price given their assumed inverse relationship.
On the other hand, should the release showcase stubborn or even an acceleration of inflationary pressures, it could validate the Fed’s option to adopt a more gradual rate-cutting path which may be perceived as hawkish in nature and could thus have the opposite effect of our aforementioned scenario.
Gold Technical Analysis
XAUUSD 4H Chart
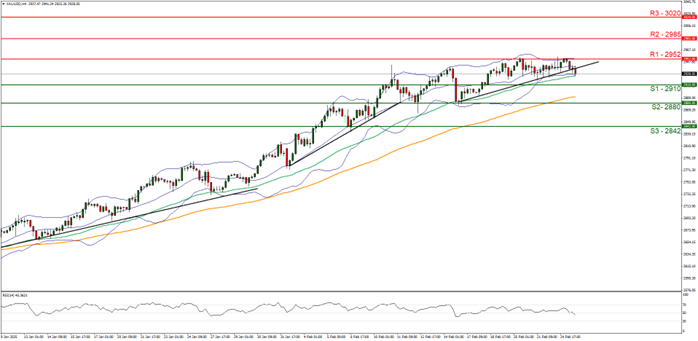
- Support: 2910 (S1), 2880 (S2), 2842 (S3)
- Resistance: 2952 (R1), 2985 (R2), 3020 (R3)
Gold formed new all time high’s during Monday’s trading session, yet at the time of this report appears to be withdrawing from that recently formed all-time high figure. We opt for a neutral outlook for gold’s price and supporting our case is the RSI indicator below our chart which currently registers a figure close to 40, implying that the bullish momentum driving gold’s price higher, may be facing some headwinds.
Moreover, we would like to note the break below our upwards moving trendline which was incepted on the 14 of February. As a side note, the aforementioned RSI indicator could also imply that the bears may be taking control of the precious metal’s price direction. Nonetheless, for our sideways bias to be maintained we would require gold’s price to remain confined between the 2910 (S1) support level and the 2952 (R1) resistance line.
On the flip side, for a bearish outlook we would require a clear break below the 2910 (S1) support level with the next possible target for the bears being the 2880 (S2) support base. Lastly, for a bullish outlook we would require a clear break above the 2952 (R1) resistance line, with the next possible target for the bulls being the 2985 (R2) resistance level.
면책 조항:
고지 사항: 본 정보는 투자 자문이나 투자 권유가 아닌 마케팅 커뮤니케이션으로 간주해야 합니다.


