

In today’s report we are to have a look at the upcoming release of the FOMC’s last meeting minutes and discuss the recent tariff developments. For a rounder view we intend to conclude the report with a technical analysis of gold’s daily chart.
FOMC minutes due out tomorrow
The FOMC’s June meeting minutes are due to be released in tomorrow’s American session. The FOMC’s last meeting minutes may garner significant attention considering the comments made by the Fed Chair that the Fed would’ve cut rates this year had there not been tariffs. As such the bank’s accompanying statement may garner significant attention from market participants who may looking to seek further information as to how the bank may proceed with their monetary policy going forward.
Moreover, given the resurgence of tariffs over the past few days, any hawkish comments such as the possibility of remaining on hold may be intensified and could aid the dollar whilst weighing on the precious metal’s price.
However, should the minutes showcase a willingness by policymakers to resume on their rate cutting path, it may be perceived as dovish in nature which in turn could weigh on the dollar whilst aiding gold’s price given their inverse relationship. In our view, we would not be surprised to see references being made to the ongoing uncertainty surrounding the US economy as a result of tariffs.
Moreover, the Government’s fiscal policy may be implied as a possible reason for the bank to maintain its cautionary monetary policy approach.
Tariff Bonanza returns
Tariff season is back in full swing and could thus lead to heightened volatility. In particular, Trump’s July 9 tariff implementation deadline appears to have been pushed back to the 1st of August which would provide leeway for nations which have yet to agree to new trade terms with the US.
The extensions appear to have calmed market worries about a possible repeat of the high volatility environment which emerged when the tariffs were first announced and thus the aforementioned extension may have weighed on gold’s price.
However, with President Trump announced a possible 25% tariff on Japan and South Korea and his comments that “Any country aligning themselves with the Anti-American policies of BRICS, will be charged an ADDITIONAL 10% tariff. There will be no exceptions to this policy”, could lead to market worries about the state of the global economy .
In particular, per Reuters China has warned the US administration today against reigniting trade tensions. Therefore, should the fragile trade truce which was struck between the US and China appear to be falling apart it may raise market worries about the state of the global economy, which in turn could aid gold’s price.
Gold Technical Analysis
XAUUSD 4H Chart
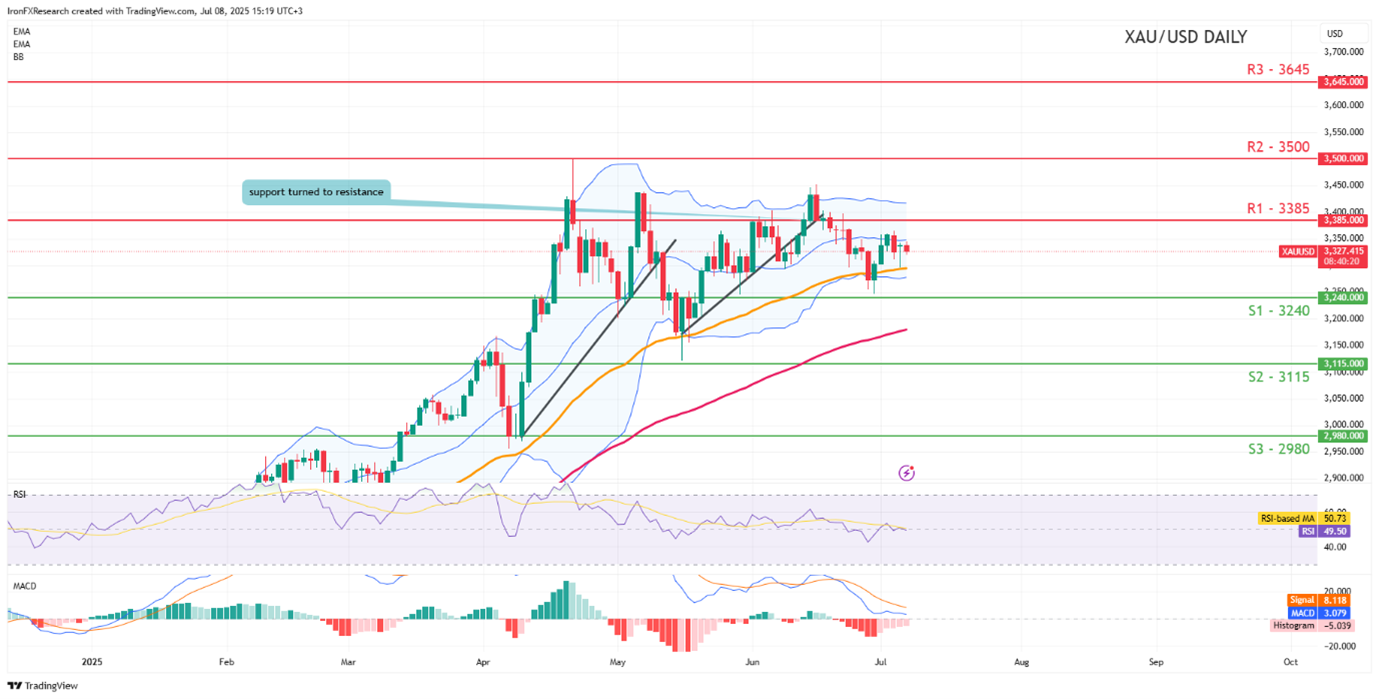
- Support: 3240 (S1), 3115 (S2), 2980 (S3)
- Resistance: 3385 (R1), 3500 (R2), 3645 (R3)
XAU/USD appears to be moving in a sideways fashion. We opt for a sideways bias for the precious metal’s price and supporting our case is the RSI indicator below our chart which currently registers a figure near 50 implying a neutral market sentiment. For our sideways bias to be maintained we would require gold’s price to remain confined between our 3240 (S1) support level and our 3385 (R1) resistance line.
On the other hand, for a bullish outlook we would require a clear break above our 3385 (R1) resistance line with the next possible target for the bulls being the 3500 (R2) resistance level. Lastly, for a bearish outlook we would require a clear break below the 3240 (S1) support line with the next possible target for the bears being the 3115 (S2) support level.
면책 조항:
고지 사항: 본 정보는 투자 자문이나 투자 권유가 아닌 마케팅 커뮤니케이션으로 간주해야 합니다.


