
Since our last report , gold’s upward direction seems to have been maintained last week yet the precious metal’s price is currently lower than Monday’s opening figure. In today’s report, we are to discuss the possible implications of the Fed’s interest rate decision later on today, and for a rounder view, we will conclude the report with a technical analysis of gold’s daily chart.
Fed interest rate decision today
The Fed’s interest rate decision is set to occur later on today. The majority of market participants are currently anticipating the bank to remain on hold in their meeting tomorrow, with Fed Fund Futures currently implying a 99.5% probability for such a scenario to materialize. The market also seems to expect the bank to proceed with a rate cut in the June meeting with a second rate cut potentially occurring in October.
Nonetheless, with the markets having almost fully priced the possibility of the bank remaining on hold, our now attention turns to the bank’s accompanying statement, in addition to Fed Chair Powell’s press conference which is set to occur half an hour after the decision. The first impact may be seen following the bank’s accompanying statement, with a secondary effect emerging from the press conference.
Overall, should Powell’s press conference and accompanying statement be interpreted as predominantly hawkish in nature, i.e implying a prolonged period of time in which the bank could remain on hold, we may see the event aiding the greenback, whilst weighing on the precious metal’s price given their assumed inverse relationship.
On the other hand, should the accompanying statement and Powell’s press conference be perceived as dovish in nature, it may weigh on the dollar, whilst aiding Gold’s price.
Lastly, should the two events appear to contradict one another, it may lead to a mixed market reaction. In our view, we would not be surprised to see the Fed taking a step back from the possibility of aggressive rate cuts and references being made to the administration’s policies and their possible impact on the Fed’s dual mandate.
The Trump Tariff Playbook
The new administration may be preparing to impose tariffs on the 1st of February which is this Saturday. Specifically, we are referring to the comments made about a possible 25% tariff on imports to the US from Mexico 그리고 Canada, which President Trump has been referring to over the past week or so.
Moreover, the President implied that he wishes to impose across-the-board tariffs that are much bigger than the 2.5% rate that was reportedly favoured by Treasury Secretary Scot Bessent per Bloomberg. Furthermore, over the weekend the President threatened a 50% tariff on Colombia after the nation’s government initially denied entry to planes carrying migrants that were deported from the US.
The bigger picture, in our view is that the President is willing to use tariffs as a negotiating tactic to the point where any “concessions” such as a lower tariff rate may be considered “moderate”. Nonetheless, the possibility of wide-ranging tariffs could lead to trade wars and heightened geopolitical tensions, which in turn could funnel inflows into the precious metal, given its status as a safe-haven asset.
Gold Technical Analysis
XAUUSD 4H Chart
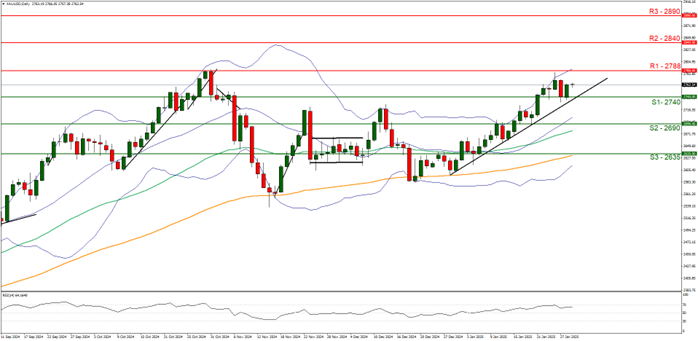
- Support: 2740 (S1), 2690 (S2), 2635 (S3)
- Resistance: 2788 (R1), 2840 (R2), 2890 (R3)
On a technical level, gold’s price continued its upwards journey, venturing close to the 2788 (R1) resistance line. We opt for a bullish outlook for the precious metal’s price and supporting our case is the RSI indicator below our chart which currently registers a figure above 60, implying a bullish market sentiment.
Moreover, supporting our bullish outlook, is the upwards-moving trendline which was incepted on the 30 of December. For our bullish outlook to continue we would require a clear break above the 2788 (R1) resistance line, with the next possible target for the bulls being the 2840 (R2) resistance level.
On the flip side, for a sideways bias we would require the precious metal’s price to remain confined between the 2740 (S1) support level and the 2788 (R1) resistance line. Lastly, for a bearish outlook we would require a clear break below our 2740 (S1) support level, if not also our aforementioned upwards-moving trendline, with the next possible target for the bears being the 2690 (S2) support level.
면책 조항:
고지 사항: 본 정보는 투자 자문이나 투자 권유가 아닌 마케팅 커뮤니케이션으로 간주해야 합니다.


