
Over the past week, major US stock market indexes moved lower. Today we have a look at the release of the US CPI rates during the American session, whilst also discussing the recent announcement of export restrictions from the US to China. For a rounder view, we are to conclude the report with a technical analysis of S&P 500’s daily chart.
US CPI rates due out today
The US CPI rates for December are set to be released during today’s American trading session. Economists are currently predicting the CPI rate on a year-on-year basis for the month of December, to come in at 2.9% which would mark an acceleration of inflationary pressures in the US economy, when compared to last month’s rate of 2.7%. In such a scenario, the implications of an acceleration of inflationary pressures in the US economy, could lead to aggravated calls for the Fed to maintain its restrictive monetary policy for 2025 and could thus anchor the current expectations of one rate cut for the year, in the bank’s September meeting. In turn, this may aid the greenback whilst weighing on the US Equities as it would imply that financial conditions surrounding the markets may remain tight. On the flip side, should the CPI rates come in lower than expected and thus imply easing inflationary pressures or a lower-than-expected acceleration, it could have the opposite effect, as it may allow some leeway for the Fed should it decide to cut earlier than what is currently expected. Hence, such a scenario could potentially aid the US Equities markets.
US announces chip export controls to China
The US announced earlier on this week, that it would be announcing export controls on chips used for artificial intelligence, in an attempt to curb China’s chip development progress. The export controls are perceived as an attempt to increase the difficulty for China and other adversaries to acquire advanced technology that may be used in military applications. The policy would create a three-tier licensing system for chips that are used for data centers and AI computations, with the most restrictive tier also including nations such as China, Iran, Russia and North Korea according to the FT. Such export restrictions may hinder sales from tech giants such as Nvidia, Intel and AMD to China, which is a significant market for these companies. In turn, the reduced availability to export their products could decrease their future revenue and thus could impact their earnings in the long run. Furthermore, the possibility of the aforementioned scenario could weigh on the aforementioned stock prices of those companies for the aforementioned reason. Moreover, given NVIDIA’s significance and heavyweight status in the NASDAQ 100, it could also negatively impact the price of the index as well. In conclusion, should we see more measures stemming from the US Government either from the outgoing Biden administration or the incoming Trump administration in an attempt to curb chip exports to China, it could weigh on the US stock markets in addition to the respective stock prices of the aforementioned companies.
기술적 분석
US500Cash Daily Chart
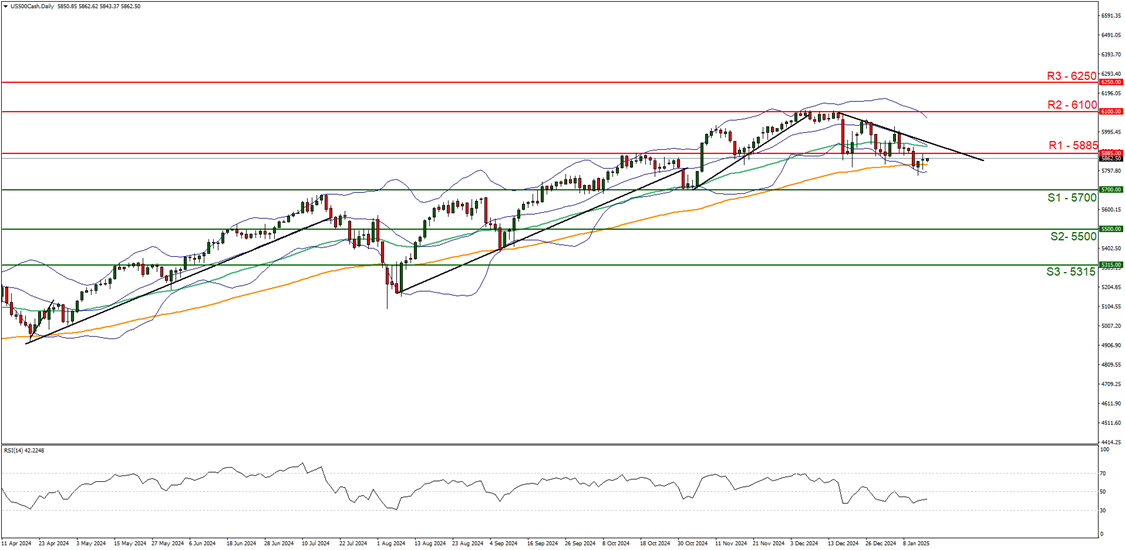
- Support: 5700 (S1), 5500 (S2), 5315 (S3)
- Resistance: 5885 (R1), 6100 (R2), 6250 (R3)
The S&P500 appears to moving in a downwards fashion, with the index having broken below our support now turned to resistance at the 5885 (R1) level. We opt for a bearish outlook for the index and supporting our case is the RSI indicator below our chart which currently registers a figure near 40, implying a bearish market sentiment in addition to the downwards moving trendline on the 17th of December. For our bearish outlook to continue, we would require a clear break below the 5700 (S1) support level, with the next possible target for the bears being the 5500 (S2) support base. On the flip side, for a bullish outlook to occur, we would require a clear break above the 5885 (R1) resistance line, with the next possible target for the bulls being the 6100 (R2) resistance level. Lastly, for a sideways bias to occur, we would require the index to remain confined between the 5700 (S1) support level and the 5885 (R1) resistance line.
이 기사와 관련된 일반적인 질문이나 의견이 있으시면 저희 연구팀으로 직접 이메일을 보내주십시오 research_team@ironfx.com
면책 조항:
본 자료는 투자 권유가 아니며 정보 전달의 목적이므로 참조만 하시기 바랍니다. IronFX는 본 자료 내에서 제 3자가 이용하거나 링크를 연결한 데이터 또는 정보에 대해 책임이 없습니다.


