
We tend to note that the S&P 500, NASDAQ 100 appear to have managed to have stopped the bleeding and at the time of this report appearing to be moving in an upwards fashion since the beginning of the week. However, the DOW Jones 30 at the time of this report have moved lower since last week’s report, despite the apparent U-turn in the other two major indexes. In this report, we are to take a different approach than usual and focus mostly on major fundamental issues that surround the US stock markets and end the report with a technical analysis of a US stock market index for a more rounded view.
S&P downgrades some US banks
Following the decision by Moody’s to downgrade 10 US regional banks and a Fitch credit rating analyst warning that the may be forced to downgrade a number of US banks, including JPMorgan&Chase. It would appear that S&P has also joined on the downgrading bandwagon, having downgraded multiple US banks on Tuesday after citing “tough” lending conditions. The “tough” lending conditions, appear to be in line with fears that the banks may be overexposed to commercial real estate, seems to be at the top of the credit rating agency’s concerns. Furthermore, should more banks follow, as has been warned by the Fitch credit rating analyst, we may see heightened concern in the US banking sector, as it appears that the banking sector may not be as “sound and resilient” as has been touted on numerous occasions by policymakers. Therefore, any prolonged fear of another banking crisis, could have a devastating impact on the US equities markets in the long run.
US Housing worries intensify
Since last week’s report, the US Preliminary building permits figure for July and the US existing home sales figure for July, both came in lower than expected. The financial releases, could be indicative of a decline in demand for US housing, as there was a reduction the request for building permits, seems to indicate that construction requests may be gradually declining, in addition to the current home sales figure may be indicative of reduced demand in housing. Therefore, by combining the two financial releases, it could be perceived as a slightly worrying picture for the US Housing market, potentially drawing comparison to the 2008 housing market crisis. As such, should the financial releases continue to support a deterioration in the US housing market, then we may see heightened worries, seeping into the equities markets and potentially weighing on the equities market. In conclusion, two financial releases do not in our opinion constitute the end of days for the US housing market, yet they could be perceived as an early warning signal that there may be an issue in the future.
BestBuy (#BestBuy) and Baidu (#BIDU) report their earnings
Baidu greatly exceeded earnings expectations by posting earnings per share and revenue coming in at $3.09 and $4.67B respectively, beating market analysts expectations. Despite market worries about China’s economic recovery, it appears that investors have placed a great focus on Baidu’s “Ernie Bot” which may be compared to Baidu’s AI alternative to ChatGPT, thus potentially maintaining the AI hype train despite China’s current economic woes. On the other hand, BestBuy (#BestBuy) beat its EPS expectations by reporting $1.15 EPS, yet noted a decline in revenue, posting in the actual figure of $9.47B. The reduction in revenue, could be concerning for one of the US retail giants, in regards to the health of the regular American consumer and their spending habits. Therefore, the earnings report by BestBuy could be cause for concern, yet Walmart’s (#WMT) earnings came in better than expected, thus potentially mitigating the potential impact on the overall market from BestBuy’s earnings report.
Earnings reports
In addition, stock traders may still have to navigate through earnings reports which are being released. We make a start on Tuesday with HP INC (#HPQ) and NIO (#NIO) then on Thursday we note UBS Group (#UBS) earnings release.
기술적 분석
#NVIDIA H4 Chart
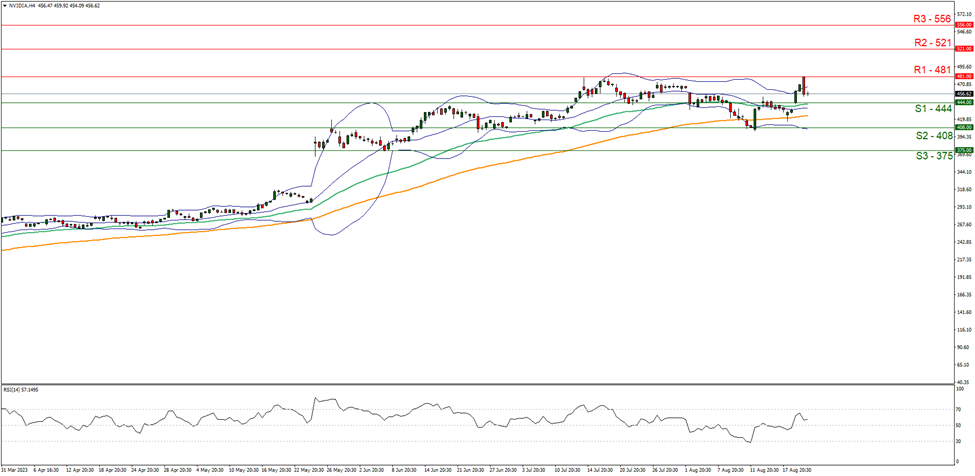
Support: 444 (S1), 408 (S2), 375 (S3)
Resistance: 481 (R1), 521 (R2), 556 (R3)
NVIDIA appears to be moving in an upwards fashion, despite failing to break above the 481 (R1) resistance level. We tend to maintain a bullish outlook for the stock and supporting our case is the RSI indicator below our 4-Hour chart which currently registers a figure above 50, implying a bullish market sentiment. For our bullish outlook to continue, we would like to see a clear break above the 481 (R1) resistance level with the next possible target for the bulls being the 521 (R2) resistance ceiling. On the other hand, for a bearish outlook we would like to see a clear break below the 444 (S1) support level, with the next possible target for the bears being the 408 (S2) support base.
이 기사와 관련된 일반적인 질문이나 의견이 있으시면 저희 연구팀으로 직접 이메일을 보내주십시오 research_team@ironfx.com
면책 조항:
본 자료는 투자 권유가 아니며 정보 전달의 목적이므로 참조만 하시기 바랍니다. IronFX는 본 자료 내에서 제 3자가 이용하거나 링크를 연결한 데이터 또는 정보에 대해 책임이 없습니다.


