
Major US stock market indexes moved lower since last week, marking three straight weeks in the red’s and should they remain on their current trajectory up until Friday’s closing bell, this would be the fourth week in a row. Today we are to have a closer look at the US trade wars, the release of the US CPI rates and the most recent news for Intel. For a rounder view we are to conclude the report with a technical analysis of S&P 500’s daily chart.
US trade wars in full swing
The US’s trade war with its Allies is now in full swing. In particular, we are referring to the most recent escalation with Canada where the Premier of Ontario Doug Ford stated earlier on this week that he planned to impose a 25% tariff on “electricity” being sent to the USA, with the US stating that they would be implementing an additional 25% tariff on all steel and aluminium imports from Canada, as a retaliatory measure. The aforementioned tariffs have since been rescinded, with White House trade advisor Navarro implying on CNBC that President Trump no longer plans to raise tariffs on Canadian steel and aluminium imports and Ontario Premier Ford stating that he would be pausing the surcharge after discussions with US Commerce Secretary Lutnick. The tensions may have eased, but that picture during the writing of this report has changed, thus highlighting the volatility and fast-changing environment in regards to the tariff wars. Specifically, Reuters has reported that Canada is preparing to announce C$29.8 bln in retaliatory tariffs on the United States on Wednesday in response to U.S. President Donald Trump’s steel and aluminum tariffs. Moreover, earlier today, the EU announced that it has launched the process to impose additional countermeasures on the US, which will target roughly €18 billion worth of goods. Overall, it appears that the trade wars have just begun and could potentially escalate, which in turn may increase volatility and uncertainty surrounding the resiliency of the US economy as a result of the tariffs and could thus weigh on the US Equities markets.
US CPI rates showcase easing inflationary pressures
The US CPI rates for February were released earlier on today and tended to paint an optimistic picture in the battle against inflation in the US. In particular, the US Core and Headline CPI rates for February on a year-on-year basis came in lower than expected at 3.1% and 2.8% respectively which may imply easing inflationary pressures in the US economy. In turn, this may increase pressure on the Fed to cut rates earlier than expected which may loosen the relatively tight financial conditions surrounding the US economy. The aforementioned scenario may alleviate some of the downwards pressures faced by the US Equities markets over the past few weeks.
Intel’s foundry business
According to various media outlets, TSMC appears to be trying to rack up support from Nvidia, AMD and Broadcom to form a joint venture to operate Intel’s foundry business in the US. According to some reports, TSMC will operate Intel’s factories but will not own more than 50%. The report appears to have initially aided Intel’s stock price, yet any deal is far from being concrete and thus that picture could easily change.
기술적 분석
US500 Daily Chart
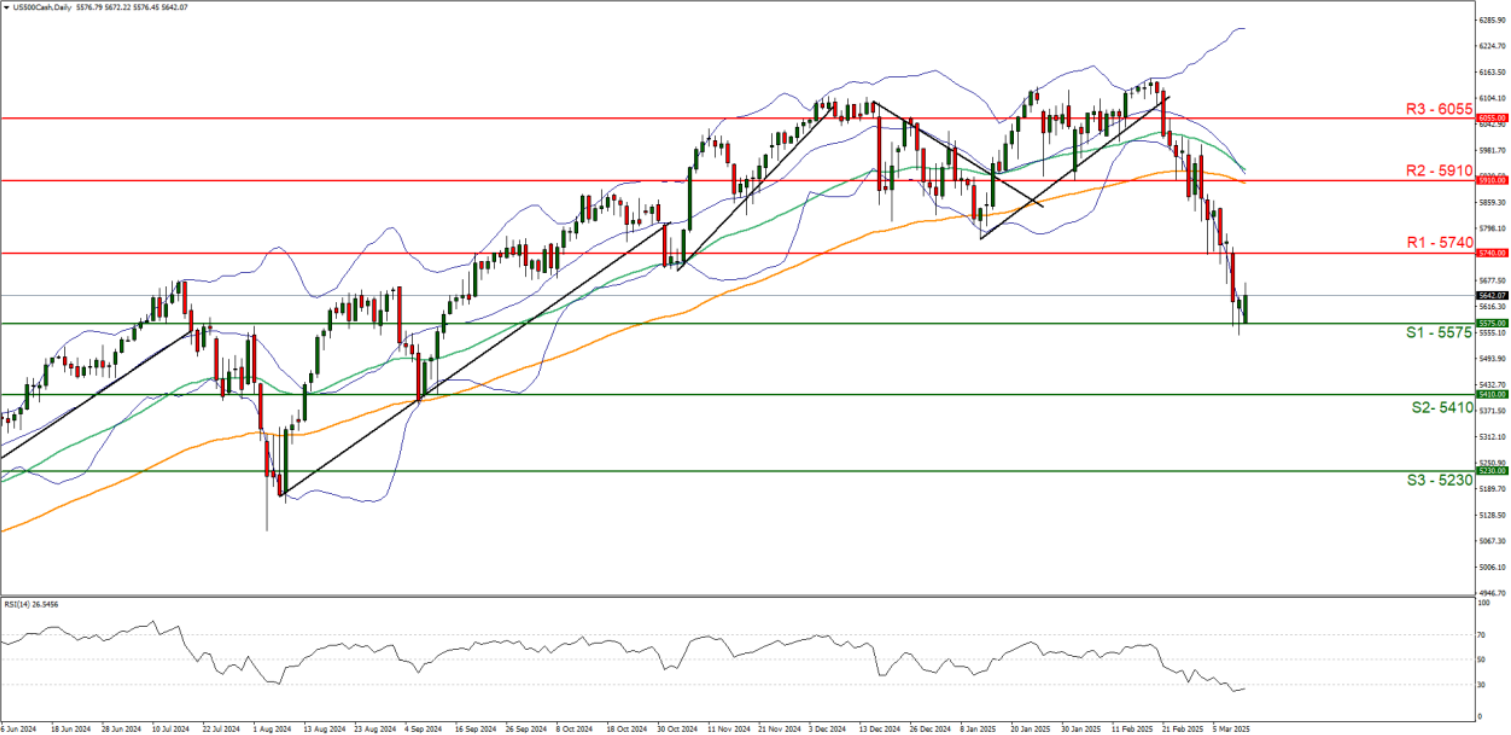
- Support: 5575 (S1), 5410 (S2), 5230 (S3)
- Resistance: 5740 (R1), 5910 (R2), 6055 (R3)
S&P 500 appears to be moving in a downwards fashion, with the pair having tested our 5575 (S1) support level. We opt for a bearish outlook for the index and supporting our case is the RSI indicator below our chart which currently registers a figure close to 30 implying a strong bullish market sentiment. Yet the figure despite being close to 30, is still under that figure which could also imply that the index may be oversold and due a correction to higher ground. Nonetheless, for our bearish outlook to continue we would require a clear break below the 5575 (S1) support level with the next possible target for the bears being the 5410 (S2) support line. On the other hand, for a sideways bias we would require the index to remain confined between the 5575 (S1) support level and the 5740 (R1) resistance line. Lastly, for a bullish outlook we would require a clear break above the 5740 (R1) resistance line with the next possible target for the bulls being the 5910 (R2) resistance level.
이 기사와 관련된 일반적인 질문이나 의견이 있으시면 저희 연구팀으로 직접 이메일을 보내주십시오 research_team@ironfx.com
면책 조항:
본 자료는 투자 권유가 아니며 정보 전달의 목적이므로 참조만 하시기 바랍니다. IronFX는 본 자료 내에서 제 3자가 이용하거나 링크를 연결한 데이터 또는 정보에 대해 책임이 없습니다.


