
Major US stockmarkets moved in green territory on Tuesday, with the move acting as a stabilization to the downward movement observed in the past weeks. On a year to date basis, the S&P500, the Dow Jones and the Nasdaq100 are in negative territory so far with the last dropping the most, leaving the tech sector somewhat exposed. Indexes could be declining due to the changing economic circumstances in the US which are currently in focus. Investors are preparing for today’s FOMC interest rate meeting with a hike of 50 basis points to be announced, likely. This report will provide a brief update on some stock movers from the past days mentioning the most probable fundamentals related.
JP Morgan announces new tool
JPMorgan Chase & Co (#JPM) gained on Tuesday adding +2.14% and closed the normal trading session at $123.03. On a year to date basis, the bank is down -22.30% while its 52-week price range is between $118.22 and $172.96. In the past days, (#JPM) announced a new tool called Tax-Smart Separately Managed Account (SMA) Platform. The tool is said to enable investors to create customized portfolios, delivers proposals to ease tax budgets along with constant portfolio management overviewing. These tools have the potential of making investing easier allowing them to combine portfolios with an advisor led approach and reporting. In other words, it is possible to meet individuals that have the money and time to invest, yet lack the know how to do it.
They may also be repelled by tax obligations which can be very complicated to deal with. Such tools allow the average investor to meet advisors that will provide support on setting up the portfolio, customizing it according to the investors priority and adjusting taxes at the same time. On a separate note, Goldman Sachs Group Inc (#GS) was also in positive territory on Tuesday gaining +1.37% and closed the normal trading session at $314.66. Some analysts tend to believe the US banking sector, especially the biggest lenders in the industry, are poised to benefit from the Federal Reserve’s possible interest rate hiking path. Higher interest rates could significantly boost gains for banks like Goldman Sachs (#GS), JPMorgan (#JPM), Wells Fargo (#WFC), Morgan Stanley (#MS) Citigroup (#C), and Bank of America (#BAC).
Moderna & Pfizer release Q1 earnings results
Another notable move was carried out by Moderna on Tuesday that followed the general trend upwards, gaining +3.14% and closed the session trading at $146.54. On a year to date basis, Moderna is down significantly by -42.30% while its 52-week price range is between $122.01 and $497.49. On Wednesday the company announced its Q1 2022 financial results with a rather optimistic outlook for the future. Moderna’s total revenue was $6.1B for Q1 of 2022, compared to $1.9B for the same period in 2021. Diluted EPS was $8.58 compared to $2.84 for the same period in 2021 and net income reached $3.7B compared to $1.2B of Q1 in 2021. The figures released beat analysts’ expectations and may have provided support for Moderna in the premarket session on Wednesday.
However, like Moderna other Covid-19 vaccine producers like Pfizer Inc (#PFE) are down on a year to date basis (-16.53%). Pfizer Inc (#PFE) announced its earnings results for the first quarter of 2022 on Tuesday the 3rd of May. Revenues reached $25.66B compared to $14.51B in the same quarter of 2021. In terms of vaccines only, Pfizer reached revenues of $14.94B compared to $4.89B in the same quarter of 2021. On Tuesday (#PFE) moved higher by +1.97% and closed the normal trading session at $49.29. In our view, both Pfizer Inc (#PFE) and Moderna delivered results that seem optimistic looking forward and may have even refute the general market sentiment that demand for vaccines could be on the low due to the virus seemingly subsiding so far in 2022.
기술적 분석
Moderna H1
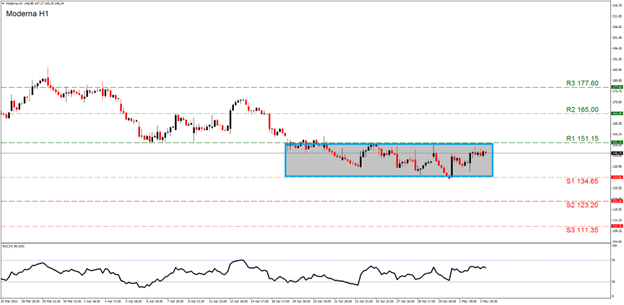
Moderna continues to trade in a sideways motion between the (R1) 151.15 resistance and the (S1) 134.65 support. This range is highlighted with a rectangle filled with grey on our chart. Since both the (R1) and the (S1) have been tested various times but not breached since the 19 of April, a break above or below this range can signal a change of the current sideways trend. In case of a movement upwards we could see the (R2) 165 line coming into play, while a move even higher could send the price action to the (R3) 177.60 level. In the scenario of a movement downwards, the (S2) 123.20 support could become a target for the bears while even lower the (S3) 111.35 level can also be engaged. The RSI indicator below out chart is currently running across the 56-level implying some bullish tendencies may be in play.
이 기사와 관련된 일반적인 질문이나 의견이 있으시면 저희 연구팀으로 직접 이메일을 보내주십시오 research_team@ironfx.com
면책 조항:
본 자료는 투자 권유가 아니며 정보 전달의 목적이므로 참조만 하시기 바랍니다. IronFX는 본 자료 내에서 제 3자가 이용하거나 링크를 연결한 데이터 또는 정보에 대해 책임이 없습니다.


