
AUD/USD 4시간 차트
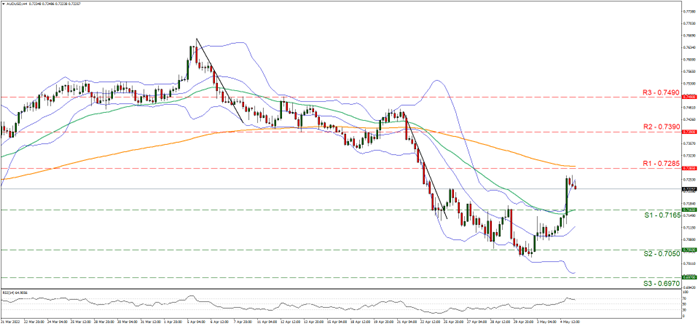
지지선: 0.7165 (S1), 0.7050 (S2), 0.6970 (S3)
Resistance: 0.7285 (R1), 0.7390 (R2), 0.7490 (R3)
시장의 전망과 같이 연준은 지난 20년 만에 기준금리를 50bp 인상하였고 이후 시장에 큰 파장이 있었습니다. the bank sounded confident citing a healthy employment market with a robust number of job gains and declining unemployment while also cited that inflationary pressures are high reflecting supply and demand imbalances. The bank also noted the hardships stemming from the war in Ukraine which could add additional upward pressure on inflation as well as the COVID-related lockdowns in China which “are likely to exacerbate supply chain disruptions”. In his press conference Fed Chairman Powell, despite foreshadowing future rate hikes to come, also stated that the bank is not actively considering 75 basis points rate hike which tended to disappoint traders and invited the greenback bears in. USD positions lost ground across the board yesterday and characteristically AUD/USD jumped breaking the 0.7165 (S1) resistance line, now turned to support.
As the pair’s price action broke the upper boundary of its past sideways movement, it seems to be advising to maintain a bullish outlook for AUD/USD. On the flipside though, the pair’s upward motion seems to have peaked and currently correcting lower. Should the buying interest be renewed, we may see the pair breaking the 0.7285 (R1) resistance line and aim for the 0.7390 (R2) resistance level. Higher than that we note the 0.7490 (R3) resistance level that capped the pair’s upward motion on the 12 of April. Should on the other hand the pair correct lower, providing for a chance to sellers to take over, we may see the pair breaching the 0.7165 (S1) support line, thus paving the way for the 0.7050 (S1) support level, while even lower we note the 0.6970 (S3) support barrier. The next risk event to be noticed for the pair would be the release of the US employment report for April tomorrow Friday the 6 of May.
GBP/USD 4시간 차트
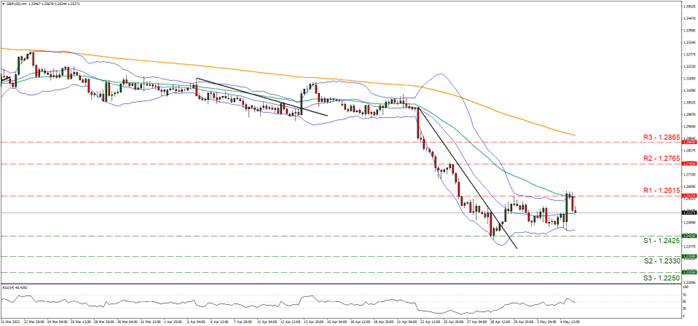
Support: 1.2425 (S1), 1.2330 (S2), 1.2250 (S3)
Resistance: 1.2615 (R1), 1.2765 (R2), 1.2865 (R3)
GBP/USD rose yesterday benefiting from USD’s weakening yet proved unable to clearly break the upper boundary of its sideways movement, namely the 1.2615 (R1) resistance line. As cable maintained its price action within the boundaries of its sideways movement, we tend to maintain a bias for a sideways motion for now, yet BoE’s interest rate decision may alter cable’s direction. Today the Bank of England is widely expected to hike rates by 25 basis points and its characteristic that GBP OIS imply that the market has fully priced in such a scenario materialising. Yet the market’s expectations are considered to be even more hawkish given that more rate hikes to come, seem to have been priced in. Therefore, BoE may have to deliver more than just a simple 25 basis points rate hike for the GBP to get some considerable bidding, otherwise pound traders may be disappointed and sell the sterling.
Should the bank deliver a 25-basis points rate hike, with the policymakers fully supporting the rate hike and the bank expressing a confident, hawkish tone to subdue inflationary pressures in the UK economy, we may see the pound gaining, as it would indirectly confirm the market’s hawkish expectations and signal that more rate hikes are to come, while anything less than that could weaken the pound. Should the bulls gain control over the pair we may see it breaking the 1.2615 (R1) resistance line which it was unable to break yesterday and aim for the 1.2765 (R2) resistance level. After the R2 we set the 1.2865 (R3) which used to be a support line back in October 2021 and has now turned to a resistance line, as the next possible stop for the bulls. If the bears take over, we may see GBP/USD dropping, breaking the 1.2425 (S1) support line that withstood the pair’s downward pressure on the 28 of April and take aim of the 1.2330 (S2) support level. Lower than that we note the 1.2250 (S3) support level.
US 30 Cash H4
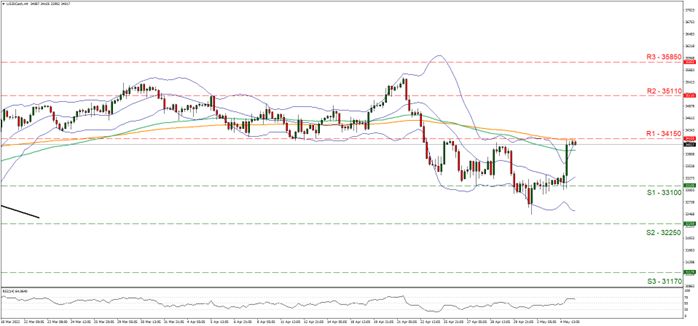
지지선: 33100 (S1), 32250 (S2), 31170 (S3)
저항선: 34150 (R1), 35110 (R2), 35850 (R3)
Dow Jones jumped at yesterday’s Fed’s interest rate decision reaching the 34150 (R1) resistance line. The index’s ascent higher pushed the RSI indicator below our 4-hour chart, near but just below the reading of 70, implying that a bullish sentiment exists in the markets. Also the price action has reached the upper boundary of the Bollinger bands, which may imply that some correction lower is possible, while the Bollinger bands widened to accommodate the price action’s sudden jump. On the other hand, cable was unable to break the 34150 (R1) resistance line, which is the upper boundary of its current sideways movement. Hence, to change our current bias in favor of a sideways movement, we would require the price action to clearly break the prementioned resistance line and the formation of higher peaks and higher troughs.
Should the bulls actually take charge of the index’s direction we may see it breaking the 34150 (R1) resistance line that stopped its ascent higher during today’s Asian session, as it is considered as the upper boundary its sideways movement since the 22nd of April and aim for the 35110 (R2) resistance line that withstood the upward pressure on the 5 of April. Higher than that, despite recognizing a possible resistance level near 35500 which is also the highest level of the price action on our chart, we set our sights on the 35850 (R3) resistance hurdle that capped the index’s upward movement on the 9 of February. To the downside we note the 33100 (S1) support line that despite being briefly broken on the 2nd of May it provided support in the days before and after proving its worth as a support line and given that we consider it as the lower boundary of the index’s sideways movement. Lower than that we also note the 32250 (S2) support line that reversed the downward motion of the index on the 24 of February and even lower the 31170 (S3) support barrier.
WTI H4
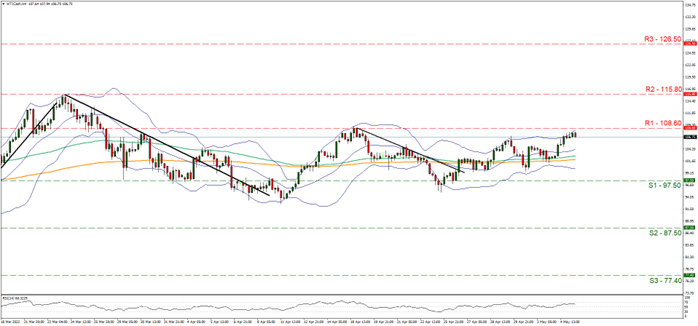
Support: 97.50 (S1), 87.50 (S2), 77.40 (S3)
Resistance: 108.60 (R1), 115.80 (R2), 126.50 (R3)
WTI rose yesterday and during today’s Asian session approaching the 108.50 (R1) resistance line. Overall we tend to maintain a bias for a sideways movement of the commodity’s price given that the main body of the price action remains confined between the 108.60 (R1) resistance line and the 97.50 (S1) support line. It should be noted that the RSI indicator below our 4-hour chart is between the readings of 50 and 70 implying a rather bullish sentiment in the market, possibly driven there also by the rise of the price yesterday, yet the price action has reached the upper Bollinger band and may imply that a correction lower is possible. It should be noted that the OPEC is to have a ministerial meeting today and on Friday and the market’s main interest lays on which decisions are to be met about production levels for oil of the member states and Russia.
Given the concerns of lower demand levels due to lockdown measures in China, a possible decision not increase production or even to curtail it could support oil prices and vice versa. Should the price of oil start rising we may see as a first sign of an incoming upward trend the breaking of the 108.60 (R1) resistance line, while even higher we note the 115.80 (R2) resistance level which capped black gold’s upward movement on the 24 of March and is the highest level reached by the price action in our chart. Higher than that we note as possible target for the bulls the 126.50 (R3) resistance level reached on the 8 of March. To the downside we note initially the 97.50 (S1) support line that is the lower boundary of the commodity’s current sideways movement, while lower than that we note the 87.50 (S2) support level. Even lower and as an ultimate target for the bears.
이 기사와 관련된 일반적인 질문이나 의견이 있으시면 저희 연구팀으로 직접 이메일을 보내주십시오 research_team@ironfx.com
면책 조항:
본 자료는 투자 권유가 아니며 정보 전달의 목적이므로 참조만 하시기 바랍니다. IronFX는 본 자료 내에서 제 3자가 이용하거나 링크를 연결한 데이터 또는 정보에 대해 책임이 없습니다.


