

The downward motion of Oil prices has been interrupted since our last oil report and moved in a roller coaster ride fashion. Fundamentals related to the international oil market tend to be intense. In today’s report, we are to have a look at the data relating to the US WTI market and continue to view the fundamentals stemming from Libya, the Israel-Palestinian conflict, OPEC and the demand side of the international WTI market. To conclude the report we will also provide a technical analysis of WTI’s daily chart.
Tightening US oil market
The US oil market seems to be tightening with the data provided in the past few days. Last Friday we got the weekly Baker Hughes US oil rig count, which showed that the number of active WTI rigs in the US remained unchanged at 483. The failure of the indicator’s reading to rise, showing that the number of active oil rigs in the US remained the same, may imply that the production levels are sufficient for current demand levels in the US WTI market, which may have been somewhat bearish for oil prices.
On Tuesday we got the API weekly crude oil inventories figure, which showed a substantial reduction of US oil inventories of 3.4 million barrels. The drawdown tended to imply that production levels have not been able to cover the aggregated demand in the US oil market in a first signal for its tightening in the past week. EIA also reported a drawdown, yet in EIA’s report the drawdown was narrowed to 846k barrels if compared to last week’s 4.649 million barrels. Despite the narrowing of the drawdown, the release tended to imply that the US oil market remained tight as demand levels in the US oil market were able to surpass oil production.
Overall, should we see data from the US WTI market in the coming week, implying further tightening of the US oil market, we may see the data providing some support for WTI prices.
Libya’s oil blockade
On a fundamental level, we note that the crisis in Libya seems to have intensified. Reuters reported that Libya’s oil blockade widened on Wednesday with eastern leaders demanding western authorities back down over the replacement of the central bank governor, a key position in a state where control over oil revenue is the biggest prize for all factions.
There is a possibility for the political dead end in Libya to evolve to military clashes which would signal a qualitative escalation of the crisis and could provide asymmetric support for oil prices.
On the other hand, should we see tensions in Libya easing and a political solution to the issue appearing on the horizon, market worries about the supply side of the international oil market easing and thus having an adverse effect on oil prices.
Developments in the Israeli-Palestinian conflict
Another issue tantalising WTI traders on a fundamental level, are the prospects of a ceasefire deal in the Israeli-Palestinian conflict. It was reported that according to a senior US official, negotiations have made progress yet some “final details” are still to be agreed. A possible agreement for a ceasefire, or even indications towards that end could have bearish tendencies for WTI prices, as it could ease market worries for the supply side of oil.
On the flip side, should we see the negotiations for a possible ceasefire deal falling through, we may see oil prices getting substantial support as the market worries for a possible escalation of the Israeli-Palestinian conflict could be enhanced. In such a scenario we see the possibilities for an overspill of the conflict to neighbouring states being enhanced, thus evolving the Israel-Palestine conflict to a regional one, which could flare up market worries for the oil market even further.
Production and demand issues
In regards to oil production levels in the international oil market, discussions for OPEC’s intentions are ongoing. OPEC has set in place oil production quotas in order to drain excess oil in the market and the production levels are to be reviewed in a few weeks. Should the oil production organization show intentions of raising oil production, we may see and adverse effect on oil prices.
Yet we see the case for OPEC to maintain the limitations of oil production on its members to keep the oil market tight and possibly achieve a rise in oil prices.
As for demand we highlight the release of the manufacturing PMI figures for August of China primarily and the US secondly. Should the PMI figures show an increase of economic activity in the prementioned sectors we may see expectations for oil demand rising and thus supporting oil prices. On the flip side should there be indications of easing economic activity in manufacturing, we may see an adverse effect on oil prices.
기술적 분석
WTICash Daily Chart
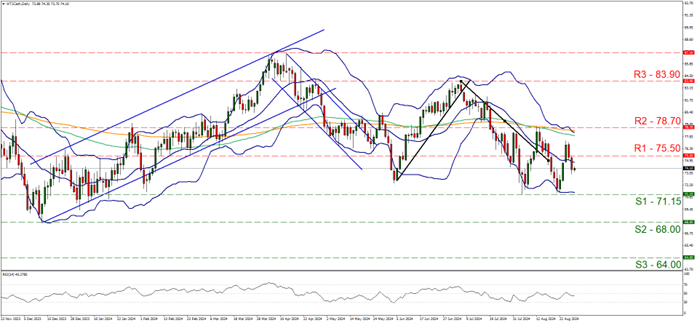
- Support: 71.15 (S1), 68.00 (S2), 64.00 (S3)
- Resistance: 75.50 (R1), 78.70 (R2), 83.90 (R3)
WTI’s price since our last report experienced a roller coaster ride, as it rose breaking the 75.50 (R1) resistance line, yet corrected below it once again. In the big picture the commodity’s price action seems to be contained between the 78.70 (R2) resistance level and the 71.15 (S1) support line, implying a wide sideways motion.
The RSI indicator is just below the reading of 50, implying a relative indecisiveness of market participants for the direction of the commodity’s price which may also allow the volatility to ease somewhat and a sideways motion to continue.
On the other hand the 20 moving average and to a lesser degree the 100 and 200 moving averages have a downward slope, which serves as a record of downward tendencies. The price action seems to be forming lower peaks, yet the troughs may have hit a floor at the 71.15 (S1) support level.
For a bearish outlook to emerge, we would require a clear break below the 71.15 (S1) support level, with the next possible target for the bears being the 68.00 (S2) support line. For a bullish outlook the bar is high, as the commodity’s price would have to rise break the 75.50 (R1) resistance line clearly and but also the 78.70 (R2) resistance level, marking a peak for WTI’s price action on the 13 of August. Higher than that we note the 83.90 (R3) resistance level, marking a peak of the commodity’s price on the 5 of July.
면책 조항:
고지 사항: 본 정보는 투자 자문이나 투자 권유가 아닌 마케팅 커뮤니케이션으로 간주해야 합니다.


