

Oil prices seemed to be on the rise since last report, yet oil bulls seem also to be taking a break over the past 24 hours. Hence today in the report we are to have a look at the data relating to the US oil market, the Fed’s interest rate decision and a wider look at the outlook of the demand side of the international oil market. To conclude the report we will also provide a technical analysis of WTI’s daily chart.
Mixed signals in the US oil market
Making a start with the US oil market we note that on Friday, Baker Hughes reported a lower number of active oil rigs in the US economy. Characteristically the number of active oil rigs dropped from 496 to 492, which is the second weekly drop in a sign of lower demand for oil in the US market.
Yet on Tuesday, we note that API reported a drop of -2.428 million barrels of US oil inventories, implying that the demand side in the US oil market surpassed oil production levels. On the flip side, EIA reported a widening of the increase of the US oil inventories the following day highlighting the possibility of a slack in the US oil market and thus mudding the waters.
Please note that the release of the EIA crude oil inventories figure had a marked negative effect on WTI’s price implying that oil traders are keeping a close eye on US oil market data releases. We expect that should in the coming week signals of a tightening US oil market emerge, they could provide some support for prices.
US inflation data and the Fed’s interest rate decision
Yet not only directly oil-related data tended to affect prices yesterday. We also had an unexpected easing of the US CPI rates for May having a bullish effect on oil prices in the early American session. Characteristically headline inflation remained unchanged in May as on a month-on-month basis, the headline CPI Rates remained at 0.0% mom.
The release tended to intensify the market’s expectations for the Fed to ease its hawkish stance which in turn could have a positive effect on economic activity for the US manufacturing sector and on the demand side of the oil market. Yet the Fed sent out some mixed signals as on the one hand the new dot plot showed the readiness of
Fed policymakers to keep rates high for longer yet on the flip side the bank seems to remain largely data-dependent and a possible wider deceleration of the CPI rates in the coming months could allow for an easing of the Fed’s monetary policy.
Should we see Fed policymakers in the coming week actually suggesting that rates are to remain high for longer, we may see the statements having a bearish effect on oil prices as they could imply indirectly an easing of the demand side of the US oil market.
OPEC’s an IEA’s monthly oil reports
Also, we note the release of OPEC’s monthly oil market report. In its report, OPEC seems to be sticking to its forecast for a relatively strong oil demand in the coming months. It should be noted that the forecasts remain optimistic despite a lower than expected consumption n the first quarter of the year.
The organisation expects world oil demand to increase by 2.25 barrels per day (bpd) in the current year and by 1.85 million bpd. It should be noted that the forecasts derive from OPEC’s last month’s expectations and landed in the current report unchanged. The optimistic demand expectations tend to support oil prices. On the flip side, we also note that the International Energy Agency in its monthly report tends to be less optimistic.
The report characteristically stated that “World oil demand growth continues to slow, with 2024 gains now seen at 960 kb/d, 100 kb/d below last month’s forecast. Weak OECD deliveries pushed global demand into a narrow y-o-y contraction in March. Subpar growth of 1 mb/d in 2025 is held back by a muted economy and accelerating clean energy technology deployment.”. The report tends to blur the picture of the international market and hence may be weighing on oil prices.
The situation in the Middle-East
In addition to IEA’s monthly oil report, we also note reports that Saudi oil exports towards China seem to have been reduced which may halt oil bulls somewhat. Also, uncertainty in the area is on the rise as the Houthis on Wednesday took responsibility for an attack by small craft and missiles on a Greek-owned coal carrier.
An intensification of uncertainty tends to support oil prices as the supply of the commodity gets under threat. On the flip side, a possible agreement between Hamas and Israel, or at least an easing of tensions for the issue could weaken oil prices.
기술적 분석
WTI Cash Daily Chart
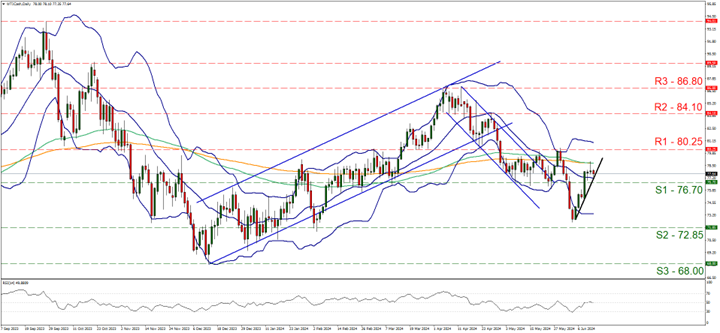
- Support: 76.70 (S1), 72.85 (S2), 68.00 (S3)
- Resistance: 80.25 (R1), 84.10 (R2), 86.80 (R3)
WTI’s price seems to have stabilised just above the 76.70 (S1) support line and a sideways motion seems to be prevailing in the past two days. We also note that the RSI indicator runs along the reading of 50 implying a rather indecisive market about the direction of the commodity’s price.
Hence one could argue for a continuance of the sideways motion. Such a prevailing of the sideways motion, would imply an interruption of the upward movement yet at the same time respect the 76.70 (S1) support line as well as the 80.25 (R1) resistance line. Yet for such a sideways motion to prevail the commodity’s price action would have to break the upward trendline guiding WTIs’ price action over the past six days. As long as the upward trendline remains intact, the bullish outlook for the commodity’s price seems to remain present.
Should the bulls maintain control over the oil’s price direction we may see it breaking the 80.25 (R1) resistance line and thus pave the way for the 84.25 (R2) resistance barrier. Yet we note that WTI’s price action peaked yesterday and started to drop, a tendency that continued during today’s Asian and European session.
Yet for a bearish outlook, we would require WTI’s price action to initially break the prementioned upward trendline in a first signal that the upward movement has been interrupted and continue to also break the 76.70 (S1) support line and take aim of the 72.85 (S2) support level.
면책 조항:
본 정보는 투자 자문이나 투자 권유가 아닌 마케팅 커뮤니케이션으로 간주해야 합니다.


