Oil’s prices continued their ascent, with the bullish sentiment continuing, as this week nears its close. In this report, we aim to shed light on the factors driving WTI’s price, assess its future outlook and conclude with a technical analysis.
US Strategic Petroleum Reserve begins to replenish its stock
According to Reuters, the US Department of energy has begun to replenish crude oil stockpiles in its Strategic Petroleum Reserve, which rose by nearly a thousand barrels since last week. The increase marks the first increase in reserves since January 2021, potentially reminder markets that the release of oil from the SPR has now come to an end, as the US begins to attempt to refills it reserves. However, it would appear that the replenishing has had little to no impact on the price of oil, yet should the US ramp up its refilling of its SPR then we may see the increases, starting to support the price of oil in the long run.
China’s worsening economic data continues to worry oil markets
China’s economic data that was released on Monday, indicated that the Chinese economy outperformed analysts expectations by growing by 0.8% for Q2 of 2023, yet compared to last quarters growth of 2.2%, could be perceived as a worrying signal for the worlds largest oil consumption giant. Furthermore, on a year-on-year level, China’s GDP failed to reach market analysts expectations of a 7.3% increase in growth and instead came in lower at 6.3%. The continued economic releases stemming from China, appear to be painting a dire picture for the economy and as such may weaken the price of oil in the long run, should China’s economy continue to underperform, despite its post covid re-opening.
Iran signals potential retaliation if its oil is unloaded from a seized tanker
According to a report by Reuters, Iran has warned against any oil company deciding to unload Iranian oil that was confiscated by US authorities in April of the coast of the Marshal islands. According to news outlets, companies usually involved in the unloading of oil from tankers, appear to be skeptical in getting dragged into an international conflict between the US and Iran, potentially fearing that Iran might target their oil ships operating in the Persian Gulf, as a retaliatory measure. Therefore, given the increased tensions between Iran and the US, we may see tit-for-tat measures , where Iran may decide to seize oil tankers, thus escalating tensions in one of the worlds most important oil arteries. In such an event, given the threat to the supply of oil, we may see oil prices edging higher due to the elevated risk.
Russia to use the Artic route to cut delivery time to China by 30%
According to Bloomberg, a Russian oil tanker named Primorsky Prospect, is sailing up the coast of Norway in order to use the Artic route to reach Rizhao in China. By using the Artic route, the oil tanker is estimated to be able to shave off two-weeks which is approximately 30% of time off the voyage, that would have taken the southern route via the Suez Canal. Given China’s increasing imports of Russian oil, we may see an increase in supply by Russia, as transportation costs are reduced, thus making it cheaper for Chinese buyers. On a macroeconomic level, if Russia continues to see increased demand from China, it may undermine its pledges and agreements with OPEC to reduce its oil production, thus potentially weighing on the price of oil in the long run.
기술적 분석
WTI Cash 4H Chart
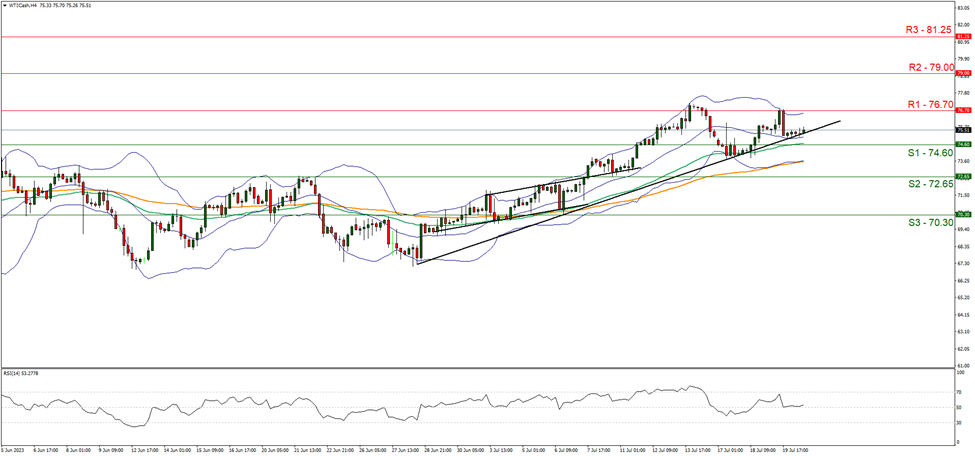
- Support: 74.60 (S1), 72.65 (S2), 70.30 (S3)
- Resistance: 76.70 (R1), 79.00 (R2), 81.25 (R3)
WTI’s price despite failing to break above the 76.70 (R1) resistance line, has continue to validate our upwards moving trendline and appears to be continuing to move higher . We tend to maintain our bullish outlook as long as the commodity’s price action remains above the upward trendline incepted since the 28 of June. Furthermore, we note that the price action has stabilized around the mid-range of the Bollinger bands, implying that the temporary reduction may have been a market correction. For our bullish outlook to continue, we would like to see the commodity breaking the 76.70 (R1) resistance line and aim to test the 79.00 (R2) resistance level. On the other hand, should the bears take over, we may see the commodity breaking the prementioned upward trendline and making a clear break below the 74.60 (S1) support level if not also aiming to test the 72.65 (S2) support base. However, we should note that the RSI indicator below our 4-Hour chart which currently registers a figure of 50, implying a neutral market sentiment. As such, should the price action remain between the 74.60 (S1) and 76.70 (R1) support and resistance levels respectively, we may see oil move in a sideways fashion.
면책 조항:
본 정보는 투자 자문이나 투자 권유가 아닌 마케팅 커뮤니케이션으로 간주해야 합니다.


