골드 started to slip over the past few days yet the overall picture of a sideways motion seems to prevail. The slight strengthening of the USD seems to have activated gold’s bears given also the recent financial releases 그리고 monetary policy 이벤트 / 사건. In this report, we aim to shed light on the catalysts driving the precious metal’s price, assess its future outlook and conclude with a 기술적 analysis.
The Fed remains on hold
Last week the Federal Reserve remained on hold, keeping interest rates steady, as was widely anticipated by market analysts, yet the release tended to boost the greenback which in turn weighed on the precious metal’s price. Fed Chair Powell reiterated on numerous occasions that despite remaining on hold, this does not mean that the Fed is done with hiking interest rates, thus leaving the door open for future rate hikes.
As the median is now revised upwards by 0.5%, it may imply that the Fed may hike two more times by the end of the year with rate cuts “a few years out” according to Powell. Interestingly, the Dot plot moved higher following the FOMC interest rate decision, with Fed policymakers now anticipating the Fed’s terminal rate to be higher than what was previously expected with the median rate by the end of the year now being 5.6% compared to March’s meeting at which it was 5.1%.
Overall the forward guidance provided by the bank tended to lean on the hawkish side which may continue to weigh on gold’s price. Furthermore, we expect the negative correlation of gold’s price to the USD to be maintained and note as the next test for gold’s price Fed Chairman Powell’s testimony before the US Congress on Wednesday and Thursday.
Should the Fed Chairman sound hawkish enough we may see the precious metal’s price dropping even further. Furthermore, we would like to draw your attention to US yields as they have been on the rise in the past week. Should the US yields continue to rise, we may see the US bond market posing as an attractive alternative to the non-interest-bearing precious metal and thus weighing on gold’s price.
China’s demand for gold eases
Demand for 골드 from China seems to be easing as the recovery of the Chinese economy seems to be facing headwinds. It should be noted that China’s trade surplus narrowed to one-year lows, an indication of fewer international trading transactions and thus lesser wealth entering the Chinese economy.
Yet that could be a consequence of the contraction of economic activity suffered by China’s crucial manufacturing sector. It’s characteristic that the Urban investment, industrial production 그리고 retail sales growth rates, all slowed down for May underscoring the difficulties faced by the Chinese economy on its road to recovery. It’s understandable that the investment of Chinese citizens in gold seems to have eased as the result of a weak recovery. It should be noted that analysts highlight the role played by China’s demand for physical gold, in driving gold’s price above the $2000 per ounce threshold.
For the time being, we note that the Central Bank of the People’s Republic of China cut lending rates in an effort to boost activity in the Chinese economy, yet the cuts delivered may not be sufficient to revive it. Overall should the difficulties for the Chinese economy to recover be extended we may see gold’s price weakening further and vice versa.
Technical Analysis – Gold
XAUUSD H4 Chart
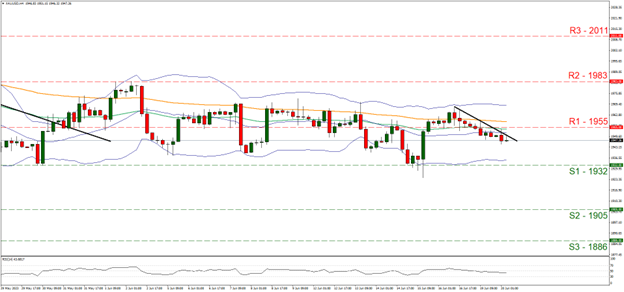
- Support: 1932 (S1), 1905 (S2), 1886 (S3)
- Resistance: 1955 (R1), 1983 (R2), 2011 (R3)
Gold’s price tended to edge lower over the past few days and broke the 1955 (R1) support line, now turned to resistance. Despite recognizing the bearish tendencies for gold as underscored by the downward trendline drawn, we regard them as rather unconvincing for the time being, given that in the big picture, the wide sideways movement between 1983 (R2) and the 1932 (S1) seems to be maintained. The RSI indicator remains below but close to the reading of 50, implying a rather indecisive market for now. For a bearish outlook, we would require the precious metal’s price action to break the 1932 (S1) support line and the next possible target for Gold’s bears could be the 1905 (S2) support level.
On the other hand, should the bulls take over, we may see the gold’s price breaking the prementioned downward trendline in a first signal that the downward movement has been interrupted, breaking also the 1955 (R1) resistance line and setting its sights on the 1983 (R2) resistance level, which is also marking the highest level in our chart currently.
면책 조항:
본 정보는 투자 자문이나 투자 권유가 아닌 마케팅 커뮤니케이션으로 간주해야 합니다.


