WTI prices remained rather stable in the past week trading between $70-$73 per barrel with fundamentals remaining the key driver behind its movement as if the market maintained a wait-and-see position. In this report, we aim to shed light on the catalysts driving WTI’s price, assess its future outlook and conclude with a technical analysis.
The situation on the ground for the US oil market
Since our last report, the US oil market seems to have eased its tightness, if not characterized by a slack. The number of active oil rigs in the US dropped to 731, if compared prior reading of 748, according to Baker Hughes, in an indication of lower demand. Also, we highlight that market expectations for a drop of US oil inventories have been disproven by API which reported a build-up of crude oil inventories in the US of almost 3.7 million barrels instead of a 1.3 million barrels drawdown which was expected. The EIA reported an even wider rise of oil inventories for the week of over 5 million barrels. Both indicators seem to align with the Baker Hughes reading in implying that demand was not able to catch up with production levels and showcased the assumption noted above, namely that there seems to be a slack in the US oil market for the week, which if intensified in the next week, may weigh on oil prices.
US defaulting?
There seemed to be considerable worries for the demand side of the oil market in the event that the US defaulted on its debt. Yet market worries tended to ease a bit about the issue in the past few days especially after US President Biden met with the Republican Speaker of the House, Congressman Kevin McCarthy. Despite the meeting not resulting in a settlement about the possibility of raising the debt ceiling, which could remove the possibility of the US defaulting, the two sides highlighted that defaulting is not an option and showed that there seemed to be some progress towards agreeing. Furthermore, US President Biden stated that he is confident that the US will not default on its debts, improving market sentiment even further. Yet we note that the US President Biden also stated that a default would be “catastrophic” and US Treasury Secretary Yellen was kind enough to remind us that the clock is ticking, seesawing the market’s nerves. Overall, we expect the issue to drag on further for the time being given that US President Biden had to go to Japan for the G7 meeting and talks are to resume on Saturday, but also given that politicians seem to be flexing their muscles. Should market worries intensify about the issue and its possible adverse effect on the demand side, we may see oil prices dropping and vice versa.
China’s prospects
Overall, we note IEA’s announcement that exactly highlights the prospect of an accelerating demand outlook and at the same time the expected tightening of oil production. Regarding the demand side it seems that China is expected to account for nearly 60% of the global demand growth for the year. Yet data from China are not exactly encouraging. After the drop of the readings of China’s manufacturing PMI figure for April, we also note the lower-than-expected acceleration of the industrial output growth rate and retail sales for the same month, which tended to imply that the recovery of the Chinese economy may not be as fast as we had expected and hence the beneficial effect on the demand side of oil may be lower.
기술적 분석
WTI Cash 4H Chart
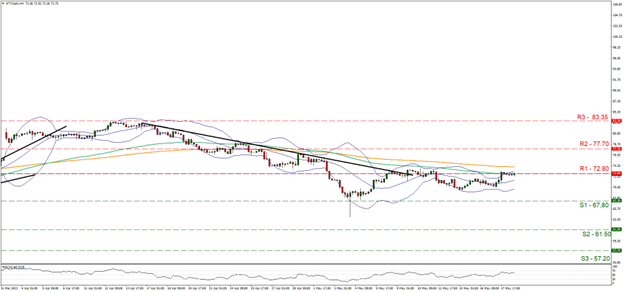
- Support: 67.80 (S1), 61.50 (S2), 57.20 (S3)
- Resistance: 72.80 (R1), 77.70 (R2), 83.35 (R3)
WTI maintained a sideways motion largely below the 72.80 (R1) resistance line. We tend to maintain our bias for the sideways motion to continue for the time being. Yet we also note that the RSI indicator remains above the reading of 50, implying a bullish residue in the market sentiment for the commodity’s price and its characteristic of how WTI’s price action took another swing at the 72.80 (R1) resistance line, yesterday. On the other hand, please note that the Bollinger bands tended to form a rather narrow path for the price action to move in, indicative of lower volatility, which may allow for the sideways motion to continue, yet the pair’s direction may alter at any given time. Should the bulls take over, we may see WTI’s price finally breaking the 72.80 (R1 )resistance line and aim for the 77.70 (R2) resistance level that kept the bulls at bay in the last days of the past month. Should on the other hand the bears take over, we may see the commodity’s price dropping and breaking the 67.80 (S1) support line in search of lower grounds.
면책 조항:
본 정보는 투자 자문이나 투자 권유가 아닌 마케팅 커뮤니케이션으로 간주해야 합니다.


