
Gold’s price appears to have stabilized in the past week, with it potentially receiving some safe-haven inflows since the beginning of the week, following the most recent developments in the Middle East.
Today we are to discuss the fundamental challenges laid ahead for the precious metal as well as financial releases that may have affected the direction of its price action. Finally, we will be concluding this report with a technical analysis of gold’s daily chart.
The correlation between USD and gold.
The classic perception of the market for a negative correlation between the USD and gold’s price seems to have not been in place over the past week. In particular gold’s price lost some ground while in the same period, the USD also edged lower. It should be noted that during the same timeframe, US yields seem to have moved lower.
Hence, we still see the case for the antagonistic relationship between gold’s price and US bonds as safe haven instruments to have been inactive in the past week. Nevertheless, should US yields start rising substantially we may see trader’s attention turning towards US bonds, as their interest-bearing status, may be more desirable to investors. In comparison, gold which is a non-interest-bearing asset, may see outflows which in turn could weigh on its price.
Overall, we expect the lack of high-impact financial releases and monetary policy events to have a subdued impact on the aforementioned factors.
Middle East Tensions flare up again.
During the early morning hours of Tuesday the 7th of May, tensions between Israel and Hamas seem to have escalated once again. The most recent development comes, as Hamas has agreed to a Qatari-Egyptian proposed ceasefire agreement, yet the proposal appears to have failed to meet Israel’s demands.
Thus, following Israel’s rejection of the aforementioned deal, Israeli forces seized control of the Gazan side of the Rafah border crossing with Egypt, effectively beginning their offensive into the southern part of the Gaza Strip. Hence, with Israel’s renewed offensive into what many international observes may have considered as a “red line”, it could lead to elevated tensions in the region, which may aid gold’s price given its safe haven status.
Yet, the silver lining may be the recent reports that an Israeli delegation will be meeting with Egyptian and Qatari officials within the next few days, to discuss a new ceasefire proposal.
Nonetheless, should tensions flare up again between Israel and its neighbours, it could lead to safe-haven inflows into gold, thus aiding its price. On the flip side, in the event of a ceasefire agreement gold may face safe haven outflows which could weigh the precious metal’s price, as tensions in the region may ease.
April’s US employment report.
The US Employment report for April was released last Friday. The NFP figure came in lower than expected at 175k, with the unemployment rate also rising to 3.9%, which was greater than what was anticipated by economists.
Therefore, the US Employment report appears to imply an easing of the US employment market, which in turn may ease the hawkishness of Fed policymakers and thus could support gold’s price. In conclusion, the implications of a loosening labour market appear to have provided minimal support for gold’s price upon their release, with the gains having since been reclaimed.
Nonetheless, should Fed policymakers ease on their recent hawkish rhetoric, it could weigh on the dollar, whilst providing support for gold’s price given their inverse relationship with one another.
Technical Analysis
XAUUSD Daily Chart
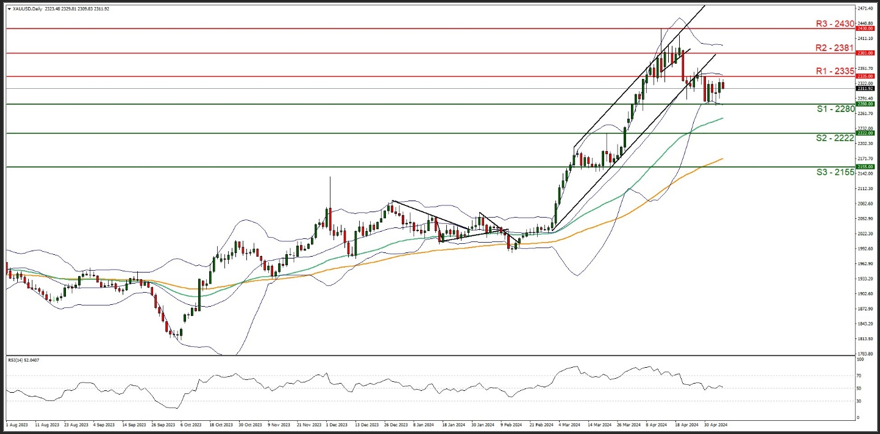
- Support: 2280 (S1), 2222 (S2), 2155 (S3)
- Resistance: 2335 (R1), 2381 (R2), 2430 (R3)
On a technical level, Gold’s price tended to continue to stabilise since our last report, confining its price action between the 2280 (S1) support line and the 2355 (R1) resistance line.
Based on the precious metal’s price action over the past week and given the clear breaking of the lower boundary of the upward channel on the 24th of April, which used to guide gold’s price, we tend to maintain a bias for the sideways motion to continue within the boundaries set by gold’s price action in the past week. Yet we also note that the RSI indicator is running just near the reading of 50, implying a rather indecisive market.
On the other hand, for a bullish outlook, we would require a clear break above the 2335 (R1) resistance line, with the next possible target for the bulls being the 2381 (R2) resistance level. Lastly, for a bearish outlook, we would require a clear break below the 2280 (S1) support level, with the next possible target for the bears being the 2222 (S2) support line.
Disclaimer:
This information is not considered investment advice or an investment recommendation, but instead a marketing communication. IronFX is not responsible for any data or information provided by third parties referenced or hyperlinked, in this communication.


