

Oil’s prices continued to be on the rise over the past week, with the bullish sentiment being intense. In this report, we aim to shed light on the factors driving WTI’s price, assess its future outlook and conclude with a technical analysis.
The situation in the US oil market
The US oil market tended to show signs of easing in the past week. It was characteristic that the number of active oil rigs in the US dropped to 540, if compared to the prior reading of 545. Furthermore, it was characteristic that the API weekly crude oil inventories figure showed a rise of US oil inventories of 3.026 million barrels. The increase of oil inventories was also confirmed by EIA as the agency reported an even wider increase of 5.946 million barrels. The releases tended to reverse last week’s reported drawdowns and imply the existence of a slack in the US oil market as demand was not able to catch up with production levels, while the reduction of the number of active US oil rigs tends to foreshadow a slowing demand.
The Saudi cuts
On the supply side of the commodity, we note that the announcement of Saudi and Russian oil production cuts tends to intensify worries about supply shortages and remove some of the uncertainty regarding the downside risks for oil prices. Hence the cuts tend to intensify the bullish sentiment of the market. Without having a direct impact on the oil market, we would like to also note headlines mentioning that Saudi Arabia imported record Russian fuel allowing thus for an export of Russian oil, yet at the same time though controlling the outflow of the commodity even further and in a more direct manner.
China’s demand
Reports surfaced this morning that China’s June crude oil imports soared 45.3% year on year, boosting the bullish sentiment for oil as China is one of the main consumers of oil globally. It seems that Chinese refineries as building up inventories, yet demand does not seem to follow yet.
The economic recovery of China seems to be slow and under doubt which may ease market expectations for the demand outlook of oil. We highlight that the manufacturing PMI figures showed another contraction of economic activity for the Chinese manufacturing sector in June, a scenario that may not have positive effects on oil.
Furthermore, it seems that both the export and the import growth rates slowed down for June and despite the trade balance being allowed to rise, China’s trade data tend also to point towards reduced economic activity. We highlight the release of Chinas’ June industrial output and Q2’s GDP growth rates and a substantial slowdown could verify further the economic slowdown, with possible adverse effects on oil prices.
Hopes for an easing of the Fed’s hawkish stance
The release of US data for June tended to enhance trader’s hopes for an easing of the Fed’s aggressive hawkish stance. It was characteristic that the core and headline CPI rates slowed down more than expected, which tended to intensify market expectations for an early end of the Fed’s rate hiking path.
Should that be the case that would allow for US economic activity to pick up and thus possibly increase demand for oil in the US, boosting its price. Furthermore we have to note that the weakening of the USD since Friday may have allowed for the commodity’s price per barrel to rise, yet we note that the de-dollarisation of the oil market may ease that phenomenon in the long run and should it be achieved.
Analisis Teknikal
WTI Cash 4H Chart
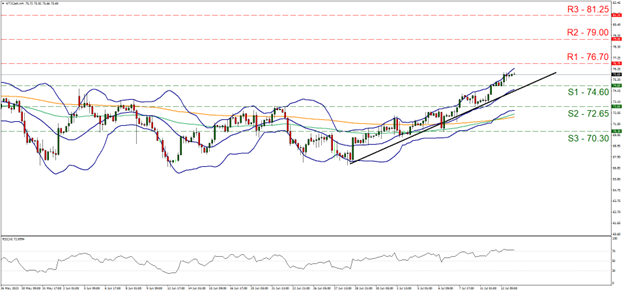
- Support: 74.60 (S1), 72.65 (S2), 70.30 (S3)
- Resistance: 76.70 (R1), 79.00 (R2), 81.25 (R3)
WTI’s price continued to be on the rise over the past few days and was able to surpass the threshold of $75 per barrel and is currently aiming for the 76.70 (R1) resistance line. We tend to maintain our bullish outlook as long as the commodity’s price action remains above the upward trendline incepted since the 28th of June.
Furthermore we note that the price action is flirting with the upper Bollinger band, while the RSI indicator is above the reading of 70 showcasing the dominance of the bullish sentiment in the markets, yet may also imply that the commodity has reached overbought levels and may be ripe for a correction lower.
Should the bulls maintain control over the commodity’s price we may see it breaking the 76.70 (R1) resistance line and aim for the 79.00 (R2) resistance base.
On the other hand should the bears take over, we may see the pair reversing course, breaking the prementioned upward trendline in a first signal that the upward movement has been interrupted, break the 74.60 (S1) support line and aim for the 72.65 (S2) support barrier, a scenario that would allow us also to draw a downward trendline, showing the limitations of the possible downward movement.
Disclaimer:
This information is not considered investment advice or an investment recommendation, but instead a marketing communication. IronFX is not responsible for any data or information provided by third parties referenced or hyperlinked, in this communication.


