

WTI’s price over the past week and since our last report, was on the rise. On a fundamental level we are to have a look at the state of the US oil market as well as factors and issues affecting the demand and supply sides of the international wti market. The report is to be concluded with a technical analysis of WTI’s daily chart for a rounder view.
US Oil market tightens
We make a start by examining the data on the ground of the US oil market. Last Friday Baker Hughes reported once again an increase of active oil rigs in the US in a signal of potentially increased oil demand pressuring oil producers in activating more wells, thus the rise of the number of active wti rigs in the US is interpreted as a bullish signal for oil prices.
The bullish signals once again intensified as API reported on Tuesday a drawdown in US crude oil inventories of -3.821 million barrels implying that oil production levels surpassed aggregated oil demand in the US once more.
Furthermore, keeping with the overall narrative the EIA the following day reported a drawdown in US crude oil inventories of -0.607 million barrels in a clear signal of a tightening of the US oil market as the prevailing narrative for the week.
In conclusion should we see the US wti market remaining tight or even tightening even further in the coming week we may see oil prices getting some support.
ExxonMobil increases their investment in Guyana
According to a statement by ExxonMobil, a final investment decision has been made for the Hammerhead development offshore Guyana, with the project expected to come online in 2029. The company will be investing $6.8 billion in the project which will include 18 production and injection wells, with the capacity to produce approximately 150 mbpd.
The company’s announcement showcases their continued dedication to expanding their oil production capabilities in the nation and could thus allow the company to increase production and possibly their sales in the long run once the project comes online. Hence although a hefty investment, it may pay itself back over the long run and could provide support for ExxonMobil’s (#XOM) stock price.
In terms of oil prices, no immediate impact may be seen considering the deadline for the project, yet an increase of wti supply in the future which could outweigh demand, may result in oil prices moving lower.
In our opinion, although this may not immediately influence the price of oil, it could instead further entice Venezuela to continue with their territorial claims in the region which could lead to a rise of tensions in the area which could in turn influence oil prices.
EU to further tighten sanctions on oil stemming from Russia
According to some various media outlets, the European Commission has stated that it was working on imposing tariffs on imports of Russian oil into the bloc, following pressure from the US President Trump. At this point in time, Hungary and Slovakia still import Russian oil via pipeline, after receiving an exemption that was only meant to be temporary.
Overall, should the bloc tighten sanctions surrounding the purchasing of Russian wti it may further constraint the supply of oil into the market, which could aid wti prices.
Oil Technical Analysis
WTI Cash Daily Chart
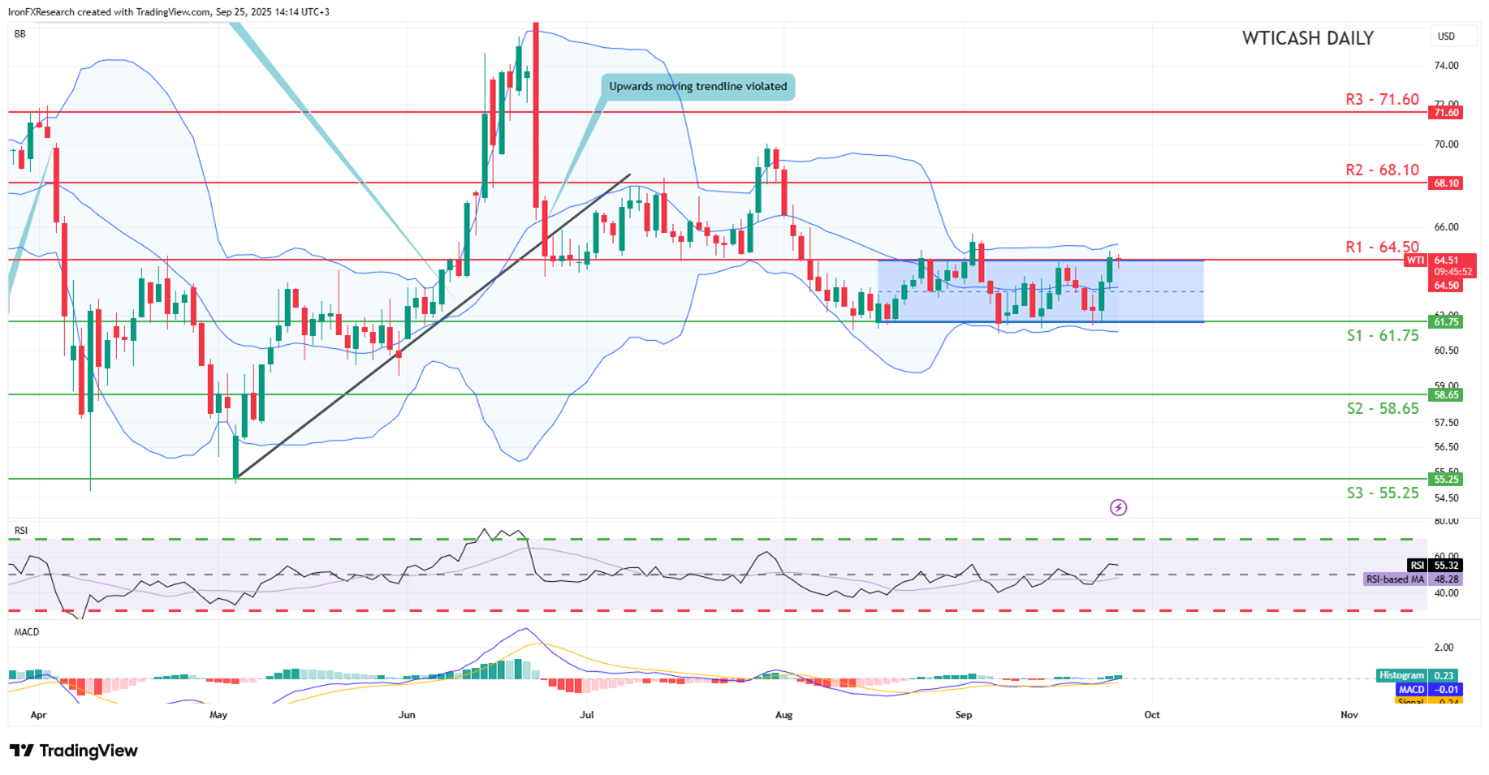
- Support: 61.75 (S1), 58.65 (S2), 55.25 (S3)
- Resistance: 64.50 (R1), 68.10 (R2), 71.60 (R3)
WTI’s price action over the past week has once again moved to test our 64.50 (R1) resistance line. We opt for a relatively sideways bias for the commodity’s price as long as it fails to clearly clear our 64.50 (R1) resistance level. For our sideways bias to be maintained we would require the commodity’s price to remain confined between our 61.75 (S1) support level and our 64.50 (R1) resistance line.
However, we would immediately opt for a bullish outlook in the event that the commodity’s price clears our 64.50 (R1) resistance line with the next possible target for the bulls being the 68.10 (R2) resistance level. Lastly, for a bearish outlook we would require a clear break below our 61.75 (S1) support line with the next possible target for the bears being the 58.65 (S2) support level.
Disclaimer:
This information is not considered investment advice or an investment recommendation, but instead a marketing communication. IronFX is not responsible for any data or information provided by third parties referenced or hyperlinked in this communication.


