
The upward movement of gold’s price seems to have begun since the end of the past week. The weakening of the USD in combination with the drop of US yields allowed gold’s price to climb higher. We expect fundamentals including the Fed’s intentions as well as financial data releases such as June’s US CPI rates to influence the precious metal’s price next week. In this report, we aim to shed light on the catalysts driving gold’s price, assess its future outlook and conclude with a technical analysis.
The US Employment report
The rise of gold’s price had become more evident on Friday as the market’s expectations for a possible worse-than-expected US employment report for June tended to grow. We have to note that the wider-than-expected drop of the NFP figure tended to disappoint traders exercising downward pressure on the USD, which allowed gold’s price to rise.
Yet a cooler look at the data provided by the US employment report for June tends to show a mixed picture. Despite the drop the NFP figure is still at rather healthy levels and the fact that the unemployment rate ticked down to 3.6%, tended to highlight that the US employment market remains tight. Even worse the average earnings growth rate did not slow down as expected, on the contrary, it even accelerated, implying that the US employment market may continue to feed inflationary pressures in the US economy.
We do not contradict the idea that the Fed’s monetary policy tightening is going to crack (to put it mildly) the tightness of the US employment market, we’re saying that it has not done so yet and that may allow the Fed to remain hawkish.
Another two rate hikes?
However on Monday the USD tended to retreat further as Fed officials proceeded with statements regarding the Fed’s intentions. There were some mixed signals as Atlanta Fed President Bostic stated that a “pretty straightforward” case seems to be building up that the inflation is to return to the Fed’s 2% with no further rate increases. On the other hand, San Francisco Fed President Daly stated that she believes that two more rate hikes are needed this year to bring inflation down.
While the more hawkish comment came from Cleveland Fed President Mester as she stated that “The economy has shown more underlying strength than anticipated earlier this year, and inflation has remained stubbornly high, with progress on core inflation stalling,” implying more rate hikes are required. Yet the market had allready priced in another two rate hikes to come and the possibility of the Fed ending its rate hiking cycle afterwards was enough for the market to sell the dollar and thus allow gold’s price to rise, something that became even more evident on Tuesday.
Next tests for Gold’s price
In the coming days, we expect gold to maintain its negative correlation with the USD and any further weakening of the USD may allow gold’s price to rise. As the next key event for gold we highlight the release of the US CPI rates for June tomorrow Wednesday. Currently, the headline rate is expected to slow down on a year-on-year level, as well as on a core level, while it is expected to accelerate on a month-on-month level.
Overall should the release show that inflationary pressures tend to ease further that may allow the USD to weaken as the market’s expectations for an easing of the Fed’s hawkish stance could intensify. Such a development very much alike with the release of the US employment report for June may allow gold’s price to rise. On the flip side should inflationary pressures remain stubbornly high, we may see the USD gaining and gold’s price dropping.
Technical Analysis – Gold
XAUUSD H4 Chart
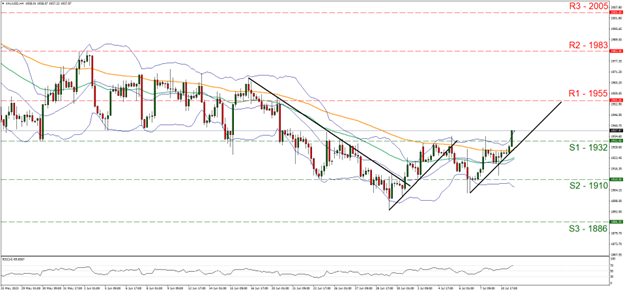
- Support: 1932 (S1), 1910 (S2), 1886 (S3)
- Resistance: 1955 (R1), 1983 (R2), 2005 (R3)
On a technical level we note that gold’s price was on the rise in the past few days breaking the 1932 (S1) resistance line, now turned to support. We tend to maintain a bullish outlook for gold’s price as long as the bullion’s price action remains above the upward trendline incepted since the 6th of July. Furthermore, we note that the RSI indicator has reached the reading of 70, showcasing the dominance of the bullish sentiment in the market, yet also warning that the precious metal may have reached overbought levels and may be ripe for a correction lower. Similar signals are being sent by the Bollinger bands as the price action has reached the upper boundary, which in turn may ease the bull’s appetite.
Should the buying interest be maintained we may see gold’s price aiming if not breaching the 1955 (R1) resistance line, while we note the 1983 (R2) resistance base, as the next possible base for the bulls. Should the bears take over, we may see the precious metal’s price reversing course, breaking the prementioned upward trendline in a first signal that the upward motion has been interrupted, break the 1932 (S1) support line and aim for the 1910 (S2) support barrier.
Disclaimer:
This information is not considered investment advice or an investment recommendation, but instead a marketing communication. IronFX is not responsible for any data or information provided by third parties referenced or hyperlinked, in this communication.
