

Gold’s price experienced a shocking drop last week, yet was able to recover the lost ground in the following days. We tend to maintain our worries for volatility to be maintained in the next week, yet at lower levels, given that the gravity and frequency of US financial releases is expected to largely ease, with some exceptions. Today we are to discuss the fundamental challenges laid ahead for the precious metal, while we will be concluding this report with a technical analysis of gold’s daily chart.
January’s US CPI rates shock the gold market
Gold’s price experienced a shock last Tuesday as the release of the US CPI rates for January took the markets by surprise. The markets were expected to slow down materially, yet on a year-on-year level, the headline rate slowed down less than expected, while the core rate failed to slow down at all. Similarly, the PPI rates failed to slow down or even accelerated, which tended to support on a qualitative level on a producer level. The releases tended to highlight the persistence of inflationary pressures in the US economy and eased market expectations for the Fed to start cutting rates early and proceed with an extensive easing of its monetary policy.
It’s characteristic that the market has now shifted its expectations and is now expecting only four rate cuts starting from June onwards, a shift that has been solidified over the past few days. Market-wise the release of January’s US CPI rates, provided extended substantial support for the USD, while the strengthening of the USD tended to weigh on gold’s price, given the negative correlation of the two trading instruments. Despite the recovery of gold’s price since the release, should the market expectations for an aggressive rate-cutting schedule on behalf of the Fed continue to retreat we may see the market sentiment weighing on gold’s price and to that end we highlight any comments on behalf of Fed policymakers in the coming days.
Fed officials and their influence
Overall we expect the market’s expectations for the Fed’s monetary policy path to be influenced substantially from any statements that are to be made from Fed policymakers in the following days. Should Fed policymakers highlight a possible faster slowdown of inflationary pressures in the US economy, we may see it supporting gold price, while on the flip side, should Fed policymakers highlight a scenario that rates remain high for longer we may see them weighing on gold’s price.
Please note that San Francisco Fed President Daly highlighted a scenario where the bank will proceed with three possible rate cuts in the year, a scenario that was also supported by Atlanta Fed President Bostic and contradicts market expectations mentioned earlier.
The next tests for Gold’s price
We highlight the release of the Fed’s January meeting minutes tomorrow as the next big test for gold’s price given also the importance the Fed’s stance has for gold market participants. In line with the analysis before, we expect that should the Fed’s meeting minutes show a decisiveness to maintain a tight monetary policy for a longer period, we may see the release weighing on gold’s price and vice versa.
Also, we note the release of the preliminary S&P PMI figures for February as well as the weekly initial jobless claims figure, both due out on Thursday. Any release that may provide some support for the USD, may at the same time weigh on gold’s price.
Gold: Technical Analysis
XAUUSD Daily Chart
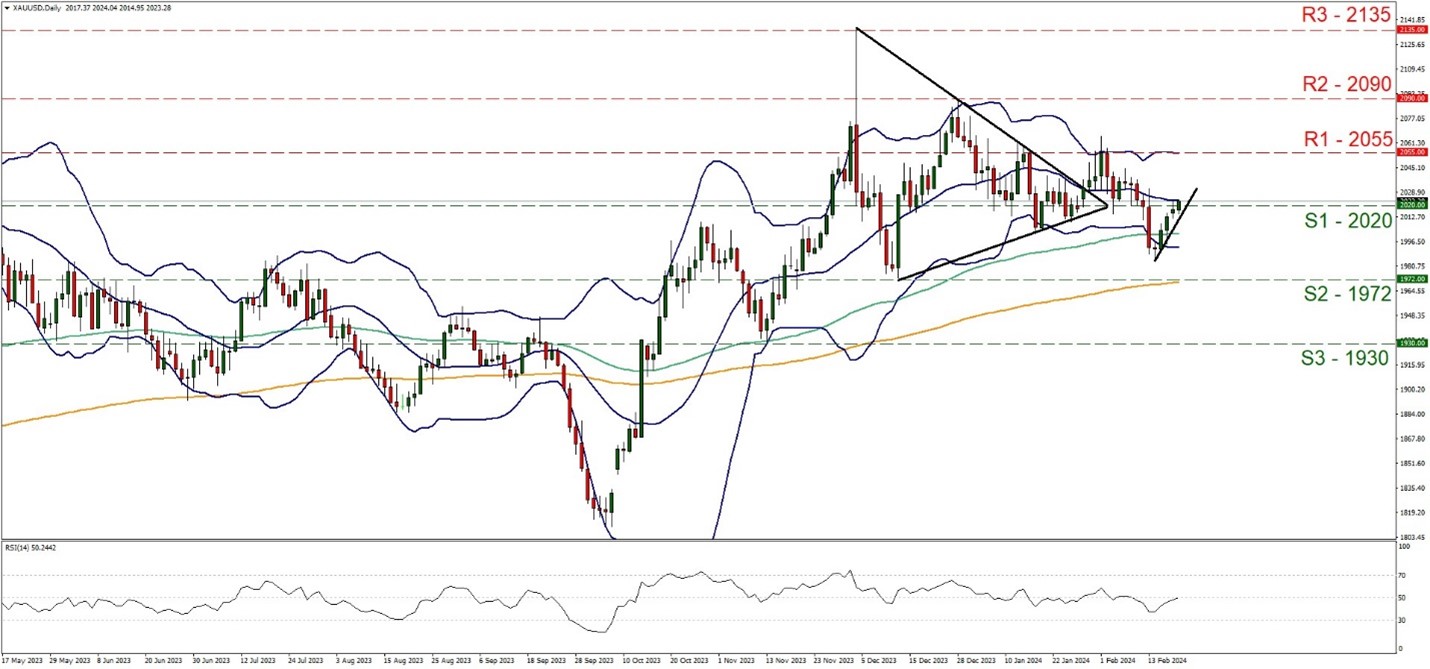
- Support: 2020 (S1), 1972 (S2), 1930 (S3))
- Resistance: 2055 (R1), 2090 (R2), 2135 (R3)
On a technical level, we note that gold’s price was able to reverse the wide losses on the day of our prior report and break the 2020 (S1) resistance line, now turned to support. As the downward movement seems to have been interrupted, and the price action of gold has broken above the reading of 2020 (S1), we switch our bearish outlook in favor of a bullish one. The consecutive upward movement of the past five days seems to have started to form an upward trendline, showing the limitations of the upward movement.
At the same time, we note that the RSI indicator is recovering and has reached the reading of 50, implying that the bearish sentiment of the market for gold’s price has faded away. We intend to maintain our bullish outlook as long as the price action remains above the upward trendline noted before. Should the bulls actually maintain control over gold’s direction, we set the next target for buyers of gold, at the 2055 (R1) resistance line, while even higher, we note the 2090 (R2) resistance hurdle.
For an extremely bullish scenario, we note the 2135 (R3) resistance barrier, which is also an all-time high for the bullions price. For a bearish outlook, we would require gold’s price, initially to break the prementioned upward trendline clearly, signaling the end of the upward movement, to continue to break the 2020 (S1) support line and take aim of the 1972 (S2) support base. Even lower we note the 1930 (S3) support level which reversed the precious metal’s downward movement in November.
Disclaimer:
This information is not considered investment advice or an investment recommendation, but instead a marketing communication. IronFX is not responsible for any data or information provided by third parties referenced or hyperlinked, in this communication.


