

Technical analysis involves analysing the historical price, volume, and volatility data of assets to identify patterns and trends in supply and demand. Traders in forex and stock markets rely on technical analysis to assess the value of a trading instrument before entering or exiting positions. Traders in the forex market widely use technical analysis to analyse short-term price movements.
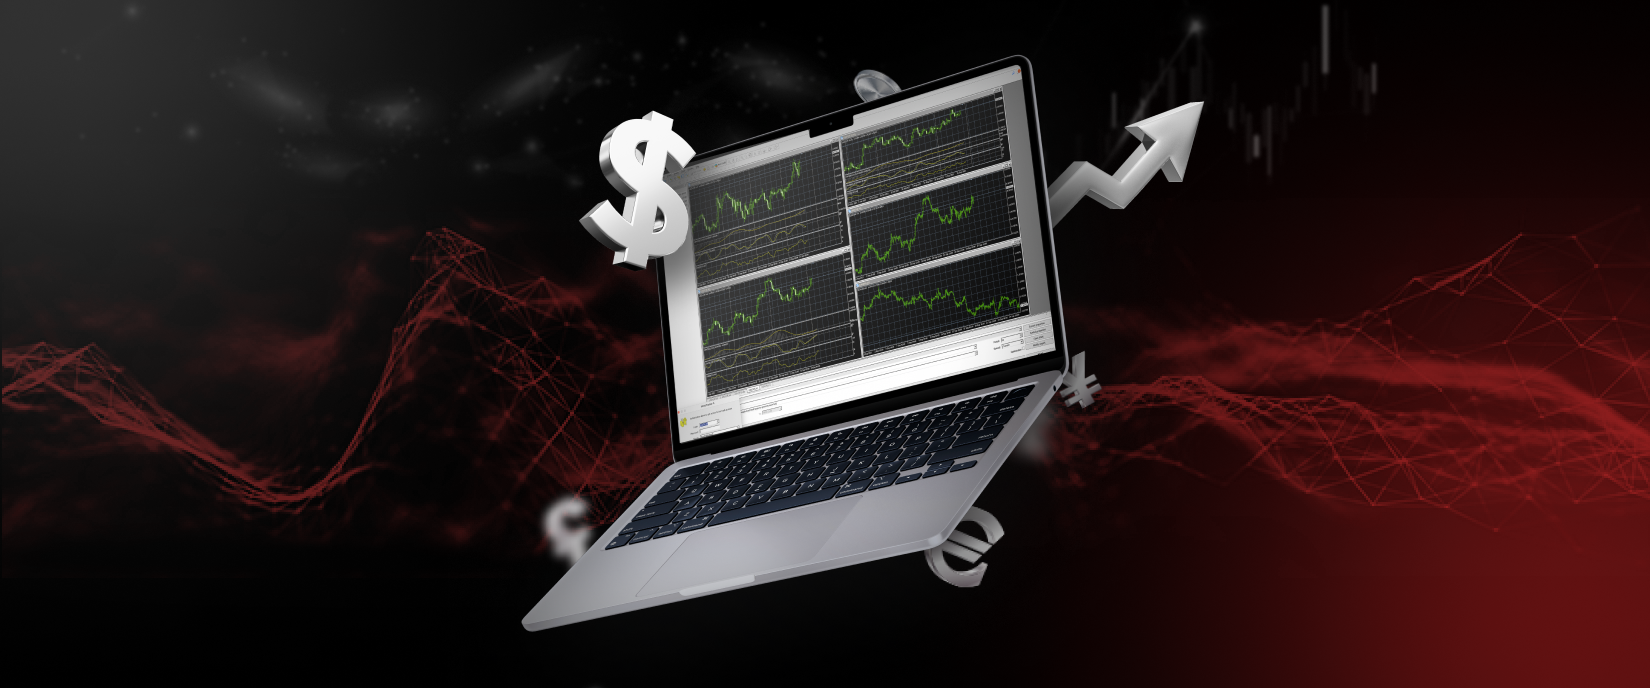
MetaTrader 4 (MT4), one of the most popular trading platforms, offers a wide range of powerful tools that can assist traders in analysing market trends, identifying patterns, and making profitable trades.
In this article, we will explore some of the top technical analysis tools on MetaTrader 4 that traders should familiarise themselves with.
What is technical analysis?
The analisis teknikal primarily involves analysing price charts, which is why traders who employ technical analysis are also called chartists. Technical analysts closely monitor trading volume and whether upward/downward price trends are being maintained.
Although technical analysis may involve complex mathematical concepts, it is actually just a way of determining if the market is rising or falling. Identifying these trends empowers you to make better informed decisions.
Assumptions of technical analysis
The principles underlying technical analysis can be summarised in three key points: the market discounts everything, price moves in trends, and history tends to repeat itself.
Pasar menghitung segalanya
Technical analysts believe that all relevant factors, including company fundamentals, market psychology and wider economic factors, are already reflected in the asset price. Therefore, technical analysts focus solely on price movements driven by demand and supply forces represented on charts.
Harga bergerak dalam tren
Technical analysis also assumes that prices follow established trends instead of moving unevenly. The trend can be either bullish or bearish and follow recognisable patterns that tend to repeat over time.
Sejarah cenderung berulang
Another assumption of technical analysis is that historical patterns and trends are repetitive, suggesting that history is likely to repeat itself. This is related to the idea that market psychology, which influences prices, often shows predictable patterns in a repetitive nature.
Tools for day traders and technical analysts
Day traders and technical analysts rely on various charting tools. These tools generate signals to buy or sell, or indicate trends or patterns in the market. Technical indicators can be categorised into two main types:
Overlays
Overlays are a type of indicator that are plotted over the top of the price bar using the same scale as prices. They provide additional information and are commonly used by traders. Examples include moving averages and Bollinger Bands and Fibonacci lines.
Osilator
An oscillator is a type of technical indicator that fluctuates within predetermined levels or a defined band, moving both above and below it. These indicators change in value over time and provide insight into the market’s momentum or overbought/oversold conditions. Examples include the stochastic oscillator, MACD, or relative strength index (RSI).
Top technical analysis indicators
Traders often use a combination of various technical indicators when analysing a security. It is essential for traders to select the indicators that align with their trading strategies and familiarise themselves with how they work. To generate trade ideas, traders may also integrate technical indicators with more subjective forms of technical analysis, such as observing chart patterns. Some of the top indicators for day trading are outlined below:
Moving averages
Moving averages are used for trend identification and market analysis. They can help to isolate trends or signal reversals. Traders may use varying time periods to calculate moving averages. A moving average that rises signifies that the instrument is in an uptrend whereas a falling moving average indicates that an instrument is in a downtrend.
Relative Strength Index
The Relative Strength Index (RSI) is a momentum indicator used to gauge the strength or weakness of a currency pair. This is done by comparing the upward movements to the downward movements over a given time period. By tracking recent price gains and losses and compares them with the current price, the RSI provides insights into the relative strength of the currency pair.
Bollinger Bands
Bollinger Bands measure price volatility and identify potential trends. They consist of three bands plotted on a price chart: a middle band, an upper band, and a lower band. During periods of high volatility, the bands widen and during periods of low volatility the bands contract. Traders use Bollinger Bands to identify potential overbought and oversold conditions in the market, as well as to anticipate potential price breakouts. These bands offer valuable insights for making trading decisions.
Fibonacci retracement
Fibonacci retracement is a technical analysis tool that assists traders in identifying key support and resistance levels. It relies on key Fibonacci ratios and helps traders anticipate price reversals or continuations. Traders can estimate potential reversal points within uptrend or downtrend by plotting support and resistance levels as horizontal lines.
MACD
The MACD (moving average convergence divergence) indicator is a momentum indicator that’s used to identify moving averages that indicate a new trend. The indicator is made up of the MACD line and the signal line. When the MACD crosses above the signal line, an uptrend may be emerging.When the MACD falls below the signal line, a downward trend may be emerging.

Ichimoku Kinko Hyo
The Ichimoku Kinko Hyo is a technical indicator that is used to assess momentum and identify areas of support and resistance levels in the market. The indicator is made up of five lines known as the tenkan-sen, kijun-sen, senkou span A, senkou span B and chikou span. These lines provide insights into short-term and medium-term market sentiment, as well as potential future support and resistance levels. Traders use Ichimoku to assess market momentum and make informed trading decisions.
Stochastic oscillator
The Stochastic Oscillator, a momentum indicator, uses support and resistance levels. It is plotted between zero and 100. During an upward trend, the price tends to make new highs. In a bearish trend, the price tends to make new lows. This indicator aids in identifying market momentum and potential trend reversals.
On-Balance Volume
On-balance volume (OBV) is a momentum indicator. This indicator uses volume flow to forecast changes in price. It reflects crowd sentiment, providing insights into potential bullish or bearish outcomes.
When on-balance volume is rising, it indicates that buyers are actively entering the market, resulting in upward price movement. A falling on-balance volume indicates that selling volume exceeds buying volume, which indicates lower prices. If price and on-balance volume are rising, that helps indicate a continuation of the trend.
Relative Vigor Index (RVI)
The Relative Vigor Index (RVI) is a momentum indicator and is used in technical analysis to gauge the strength of a trend. This is done by comparing a security’s closing price to its trading range and smoothing the results with a simple moving average (SMA).
The RVI is valuable because it capitalises on the observed pattern where prices close higher than their opening prices during uptrends and lower than their opening prices during downtrends. By analysing these patterns, the RVI provides insights into the strength and direction of the trend.
Pivot points
A pivot point is a widely used technical analysis indicator that aids in determining the overall market across various time frames. It is calculated by taking the average of the intraday high and low, and the closing price from the previous trading day. When the price trades above the pivot point on the following day, it is generally interpreted as a sign of ongoing bullish sentiment, while trading below the pivot point indicates bearish sentiment.
Gain valuable insights into the market
Mastering technical analysis tools on MetaTrader 4 enhances traders’ ability to analyse market trends, identify patterns, and make profitable trades. MT4 offers a wide range of powerful tools, and by understanding these tools and their assumptions, traders can gain valuable insights into the market and make informed decisions. Continuous learning and practice are crucial for success in trading.
Disclaimer:
This information is not considered investment advice or an investment recommendation, but instead a marketing communication. IronFX is not responsible for any data or information provided by third parties referenced or hyperlinked, in this communication.


