
WTICash H1 chart
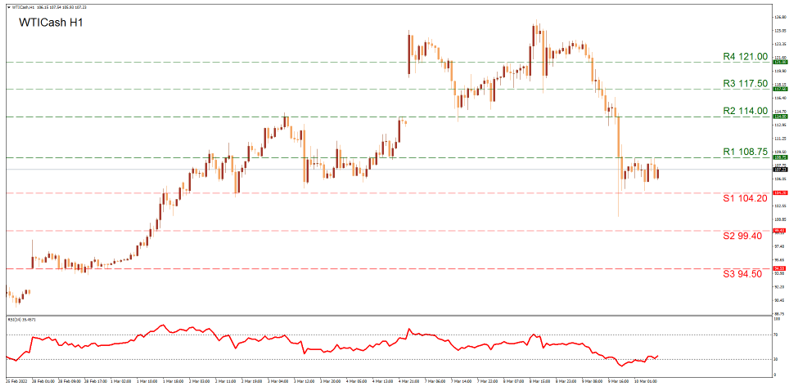
Support: 104.20 (S1), 99.40 (S2), 94.50 (S3)
Resistance: 108.75 (R1), 114.00 (R2), 117.50 (R3), 121.00 (R4)
WTI briefly tested the (S1) 104.20 but stabilized slightly higher in the early European session. If the correction continues, the (R1) 108.75 resistance could be attempted and even breached. Other levels which in our opinion can be found if the commodity continues to appreciate, are the (R2) 114.00 line and the (R3) 117.50 hurdle which were used as a support and resistance in the past days. Finally, if the buying interest increases significantly, we could also use the (R4) 121.00 line as a target for the bulls. On a different note, in case the selling trend persists then the (S1) 104.20 support could be revisited. Further to the downside, we view the (S2) 99.40 support as the most probable target while our final support is currently noted as the (S3) 94.50 line which was last engaged in late February. With the most recent correction lower, we could say that Oil has now moved into a sideways motion visiting territory seen in the past week. The RSI indicator below our chart has ascended above the 30 level and could be signalling some bullish interest in the short term. Oil traders should note the release of the U.S. Baker Hughes Oil Rig Count coming up in the late US session on the 11 of March. A notable economic release for the Oil market comes on the 15 of March with the weekly API Crude Oil stockpiles figure. Most importantly Oil traders should constantly monitor the developments in Ukraine as a solution or de-escalation of the problem can move Oil prices accordingly.
XAU/USD H4 chart
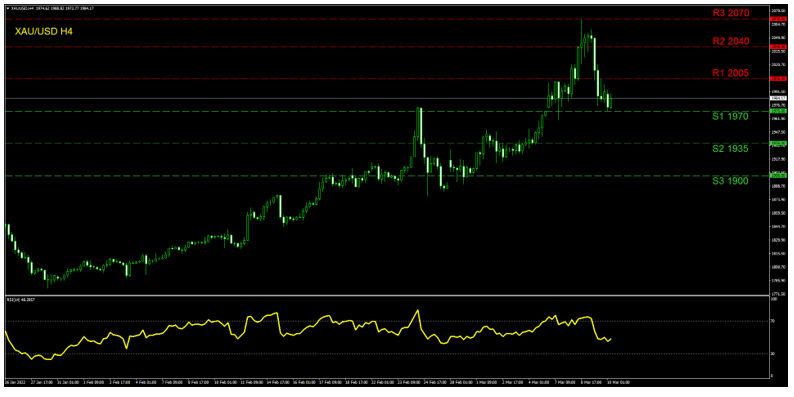
Support: 1970 (S1), 1935 (S2), 1900 (S3)
Resistance: 2005 (R1), 2040 (R2), 2070 (R3)
XAU/USD fell to the (S1) 1970 level with a non-stop selling trend formed since yesterday. If Gold continues to drop, we could see a breach below the (S1) and a subsequent movement towards the (S2) 1935 support which was tested constantly in the first days of March. In a strong selling scenario, we also note the (S3) 1900 level. On the contrary, a re-establishment of the upward trend can send the yellow metal’s price action to the (R1) 2005 resistance level, as an initial step. If the buying continues, the (R2) 2040 level is a possible target for the bulls and can be attended prior to the (R3) 2070 level which was briefly visited in the past days. Overall Gold’s correction to lower grounds has failed to reverse the upward trend in our opinion. Some sideways tendencies may prevail in the meantime, yet for the trend to be breached we may need to see a drop towards the 1900 (S3) line to be fully convinced. The RSI indicator has dropped to 50 displaying the current market uncertainty. The most significant economic release that can create strong volatility for the Gold market are the US Inflation data coming up on the 10 of March. The CPI and Core CPI rates for February are of major importance for economists and traders. At the same time and date, we also get the weekly Initial Jobless Claims figure. On the 11 of March we also get the notable Preliminary University of Michigan Economic Sentiment for March.
US500Cash H4
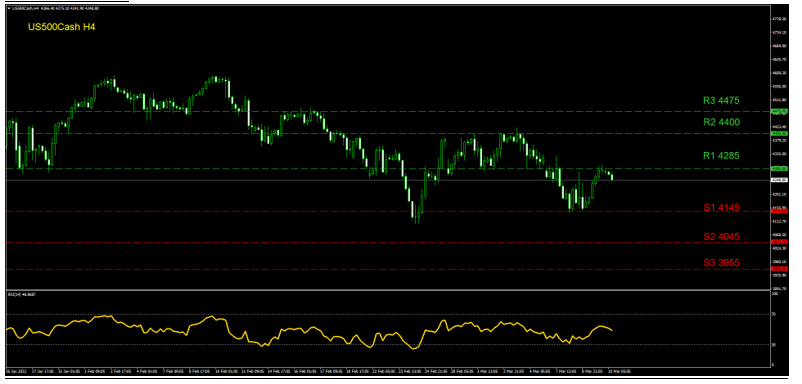
Support: 4145 (S1), 4045 (S2), 3955 (S3)
Resistance: 4285 (R1), 4400 (R2), 4475 (R3)
As the major US stockmarkets where up on Wednesday, the US500 surged to the (R1) 4285 resistance level but was unable to move above it. In a strong buying scenario, we point out the (R2) 4400 level as the most possible next stop. The (R2) was tested in the first days of March and remains the highest level reached for the current month. However, in case the surge higher continues then the (R3) 4475 is also in our opinion a great challenge for the bulls. Yet if the current downward trend is to continue, the (S1) 4145 level could be tested once again. A possible move to lower grounds could also bring into play the (S2) 4045 level which has not been tested since May 2021. Our final support stands at the (S3) 3955 line. Overall, the index remains in a selling trend with no significant evidence of any change so far. The RSI indicator remains in a descending trend confirming the bears are currently dominating the scene. In terms of economic releases, the USD Index could move upon release or anticipation of the economic data mentioned in the Gold analysis.
USDIndex H4
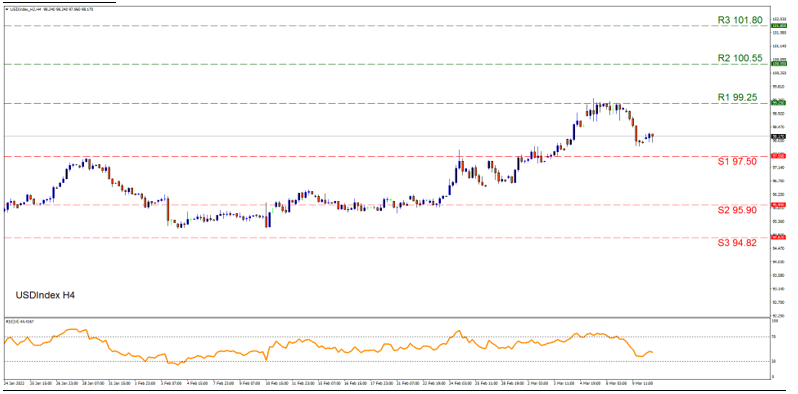
Support: 97.50 (S1), 95.90 (S2), 94.82 (S3)
Resistance: 99.25 (R1), 100.55 (R2), 101.80 (R3)
In the past days, the Dollar Index had surged to a new multiyear high level which is currently noted as the (R1) 99.25 line. Even though some correction has been observed in the latest sessions the selling has not been strong enough to force the price action to our main support which is the (S1) 97.50 level. In case traders are looking for targeted levels for a buying strategy we note the (R2) 100.55 line and higher the (R3) 101.80 hurdle. Note the (R2) and higher the (R3) are levels previously seen back in 2020 which if reached, can signal a strong bullish market. In the opposite direction, if traders are looking for levels to use in a selling trend then the (S2) 95.90 support and lower the (S3) 94.82 barrier can be useful considering these levels were previously used in February and traders may find it easier to associate with them. The recent selling orders have pushed the RSI indicator below 50 but have not managed to reverse the long-term upward trend that is more clear on a weekly chart.
Si vous avez des questions d'ordre général ou des commentaires concernant cet article, veuillez envoyer un email directement à notre équipe de recherche à l'adresse research_team@ironfx.com
Avertissement :
Ces informations ne doivent pas être considérées comme un conseil ou une recommandation d'investissement, mais uniquement comme une communication marketing. IronFX n'est pas responsable des données ou informations fournies par des tiers référencés, ou en lien hypertexte, dans cette communication.


