
Gold saw little if any volatility in the past week and yesterday, allowing for its price to remain relatively unchanged after the sharp drop it experienced from the release of the US employment report for January. We see today the release of the US CPI rates for January being critical to the direction of the precious metal’s price as the next big test which is to affect the Fed’s monetary policy stance. In this report, we aim to shed light on the catalysts driving the precious metal’s price, assess its future outlook and conclude with a technical analysis.
US CPI print to test gold
Later today, the market is expected to shift its attention towards the release of the latest inflation report from the US for the month of January and precious metal traders in particular will be glued to their seats. According to forecasts, the year-on-year CPI print is expected to ease to 6.2% from the 6.5% recorded in the previous month and should the actual rate meet the expectations we may see the dollar ease from its one-month highs, whereas gold may shine in the eyes of investors, as a result of the negative correlation between the greenback and the shiny metal. Yet forecasts are for the month-on-month rate to accelerate implying that inflationary pressures are still simmering under the surface, which may allow for the Fed’s hawkishness to endure, thus softening the blow on the USD, if not provide even a bit of support for the greenback and thus capping any gains for gold’s price if not pushing it lower. At this point would like to note the elevation of US yields since the beginning of the month as it takes some of the shine from Gold’s price given that investors may find bonds as more lucrative alternative to gold. Should US yields regain the upside momentum we may see gold’s price coming under pressure.
Fed envoys -Further tightening needed
Yesterday, Fed Governor Michell Bowman underlined that the Federal Reserve will need to raise interest rates further, to a sufficiently restrictive level, which would help bring inflation down towards the central bank’s 2% target level. Not only that but once the Fed is done with hiking the most likely scenario would be to hold rates elevated for “some time” to restore price stability, as supply and demand dynamics could exhibit signs of divergence, the Governor noted. The contents of Bowman’s speech, mirror various policymakers’ remarks over the past week, who reiterated that more needs to be done. The latest blowout employment report at the start of the month forced traders to reassess their speculative bets for a Fed pivot and renewed interest in the greenback, as the results practically leave more room for the central bank to press on with more hikes. Furthermore, the chances for a so called “soft landing” scenario, where a recession may be averted despite the high-interest rate environment, remain prominent amongst analysts’ assessments, yet the results of the latest inflation report later today, could reintroduce uncertainty amongst market participants’ views. Not only that, but the comments from policymakers following the release could provide a clearer view into how the committee’s outlook changes after an injection of fresh incoming data. Hence, we would like to highlight the scheduled speeches from Richmond Fed President Barkin, Dallas Fed President Logan, Philadelphia Fed President Harker and New York Fed President Williams later today but also other Fed policymakers that are scheduled to make statements in the coming days.
Analyser la technique
XAUUSD H4 Chart
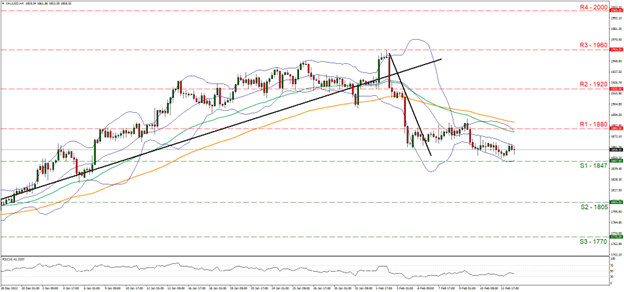
- Support: 1847 (S1), 1805 (S2), 1770 (S3)
- Resistance: 1880 (R1), 1920 (R2), 1960 (R3)
Gold’s price seems to have remained in a sideways motion between the 1880 (R1) resistance line and the 1847 (S1) support line, despite some slight bearish tendencies. For the time being we tend to maintain our bias for the sideways motion to continue. We also note that the RSI indicator below our 4-hour chart has recovered somewhat from the lows of the reading of 30 allowing for the assumption that the bearish sentiment may have eased a bit in the past few days, albeit it still remains present. Please note though that both the 100 (Green line) and 50 (Orange line) moving averages point downwards as does also the Bollinger bands median, reminding traders for a possible bearish outlook. Should the bears capitalize on the negative momentum, we may see the price action break below the $1847 (S1) support level and move lower closer to the $1805 (S2) support base. Should the bulls take over, we may see the break above the $1880 (R1) resistance level and move closer to the $1920 (R2) resistance barrier.
Avertissement :
Ces informations ne doivent pas être considérées comme un conseil ou une recommandation d'investissement, mais uniquement comme une communication marketing.


