
Since our last report, gold bulls appear to still be in the driver’s seat despite gold’s price moving lower on Monday. In today’s report we are to have a look at the market uncertainty underpinning the rise of gold’s price as well as the upcoming release of the US PCE rates . For a rounder view we intend to conclude the report with a technical analysis of gold’s daily chart.
Tariff riddles from the Trump Administration
US President Trump appears to have allowed some flexibility in his tariff decisions. According to Reuters, he stated that not all new tariffs would be announced on April 2nd and that he might exempt “a lot of countries.”
The President’s comments and his apparent flexibility on tariffs suggest potential room for negotiations.
Moreover, President Trump suggested that tariffs may not all take effect on April 2nd, indicating a gradual, case-by-case approach. This could ease market concerns about a full-scale trade war between the US and its allies.
However, the US now seems to be adopting a two-step tariff approach, with an additional 25% tariff on countries buying oil from Venezuela, according to the FT.
Nonetheless, Trump’s softer stance on tariffs suggests the administration.May be open to adjustments or agreements before they take effect on April 2nd.
In conclusion, President Trump’s softer tariff stance may ease market concerns about trade wars, potentially pressuring gold prices, a key safe-haven asset.
However, if tariffs proceed on April 2nd without significant trade agreements, gold prices may find renewed support.
US PCE rates to take the stage
The US PCE rates, the Fed’s preferred measure of inflation, could significantly impact gold prices due to its inverse relationship with the dollar.
Looking at the expectations by economists, the US Core PCE rates on a year-on-year basis have caught our eye. The prior rate was 2.6% and the current expectations are for the rate to accelerate from 2.6% to 2.7%. This which could imply an acceleration of inflationary pressures in the US economy, which in turn could increase pressure on the Fed to keep rates higher for longer.
In turn this could aid the greenback whilst weighing on the precious metal’s price given their aforementioned inverse relationship.
However, should the Core PCE rate come in lower than expected, implying easing inflationary pressures in the economy, it could increase pressure on the Fed to continue on their rate cutting path which in turn could weigh on the dollar whilst aiding gold’s price.
Gold Technical Analysis
XAUUSD 4H Chart
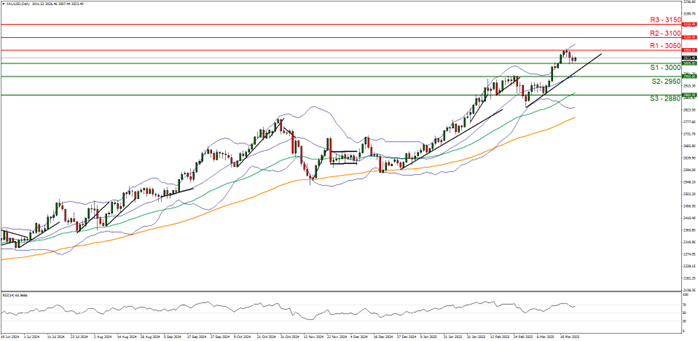
- Support: 3000 (S1), 2950 (S2), 2880 (S3)
- Resistance: 3050 (R1), 3150 (R2), 3250 (R3)
On a technical level since our last report, Gold’s price appears to have retested the 3000 (S1) support level. We opt for a bullish outlook for the precious metal’s price and supporting our case is the RSI indicator below.
Our chart which currently registers a figure close to 70, implying a strong bullish market sentiment in addition to the upwards moving trendline which was incepted on the 28
For our bullish outlook to continue, we would require a clear break above the 3050 (R1) resistance level with the next possible target for the bulls being the 3100 (R2) resistance line.
On the flip side, for a bearish outlook we would require a clear break below the 3000 (S1) support level with the next possible target for the bears being the 2950 (S2) support line. Lastly, for a sideways bias we would require the precious metal’s price to remain confined between the 3000 (S1) support level and the 3050 (R1) resistance line.
Avertissement :
Ces informations ne doivent pas être considérées comme un conseil ou une recommandation d'investissement, mais uniquement comme une communication marketing


