
Gold’s price restarted its rise over the past week. Today we are to discuss the fundamental challenges laid ahead for the precious metal, the negative corelation of the USD with gold as well as upcoming financial releases that may affect the direction of gold’s price action. Finally, we will be concluding this report with a technical analysis of gold’s daily chart.
USD’s weakening allows gold’s price to rise
We make a start with the weakening of the USD over the past week against its counterparts, for a second week in a row, which in turn allowed gold’s price to rise. The negative corelation of gold to the USD continued on Monday, even as the USD remained relatively unchanged. We expect the negative correlation between the USD and gold to be maintained, in which case should the USD cede further ground against other currencies, we may see gold’s price rising further.
Drop of US yields polishes the shiny metal
We also note that since our last report, the yields of US bonds continued to be on the decline and the drop of US yields applies to short-term as well as to long term bonds. It should be noted that the attractiveness of US bonds as safe haven instruments tends to be reduced as the drop of US yields weakens the compensation for the individual investor, while at the same time tends to increase the attractiveness of the precious metal. Should US yields continue to decline in the coming week, we may see investments being diverted from US Bonds towards gold thus providing some bullish tendencies for gold’s price.
The assassination attempt on Trump
The assassination attempt on Trump last Saturday, shocked the markets enhancing its uncertainty somewhat, yet that effect calmed down quickly. On the flip side the unsuccessful attempt, seems to be causing a rally-around-the-flag effect for Trump supporters and thus enhance the possibility for him getting elected, something that he market may allready have started to price in. Should market expectations for such a scenario continue to strengthen we may see safe haven outflows for the USD, which in turn may allow gold’s price to rise further.
US financial affect gold’s price
We highlight that the rise of the gold’s price intensified by the release of the US CPI Rates for June, past Thursday. The release highlighted the easing of inflationary pressures in the US economy over the past month. The headline rate slowed down beyond market expectations reaching 3.0% yoy, while the core rate ticked down to 3.3% yoy. The easing of inflationary pressures, in conjunction with a cooling of the US employment market for the same period, intensified the market’s expectations for the Fed to start cutting rates in September and deliver another two rate cuts within the year, one on November and one in December. The intensification of the market’s expectations tends to add more pressure on the Fed to ease its hawkishness, something that may have been implied by Fed Chairman Powell last week. We expect that should more Fed policymakers ease their hawkishness and maintain a more dovish outlook for the Fed’s intentions, we may see gold’s price getting additional support. We tend to view the Fed’s monetary policy stance as maybe the key factor behind golds’ movements, given that market-wise, the perception of the reality is the reality. In the coming week though we also note some key US financial releases that could affect gold’s price among which the US industrial production growth rate for June tomorrow Wednesday and July’s Philly Fed Business index on Thursday.
The situation in China
Our worries for the recovery of the Chinese economy tended to intensify after Monday’s Asian session, as a number of data released were alarming.
The GDP rate for Q2, and the retail sales for June slowed down beyond market expectations but also the urban investment and the industrial output growth rates decelerated, while house prices contracted deeper, all being for June.
Calls for supportive measures by the People’s Bank of China have intensified, and we may see gold purchases by the bank easing which could have an adverse effect for gold’s price if materialised.
Gold Technical Analysis
XAUUSD Daily Chart
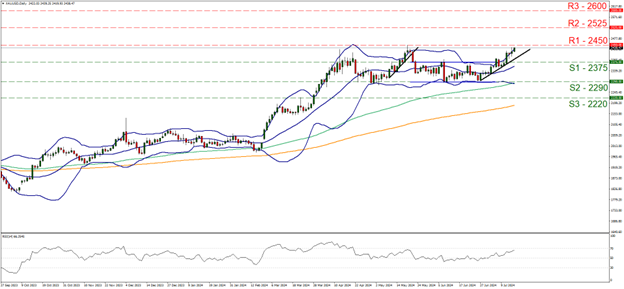
- Support: 2375 (S1), 2290 (S2), 2220 (S3)
- Resistance: 2450 (R1), 2525 (R2), 2600 (R3)
Gold’s price moved decisively higher over the past few days and is currently breaking clearly the 2375 (S1) resistance line, now turned to support. We tend to maintain a bias for the upward motion to continue as long as the upward trendline guiding the precious metal’s price remains intact.Furthermore, we note that the 20 moving average (MA, blue line) which is also the median of the Bollinger bands, the 100 MA (green line) and the 200 MA (orange line) are all pointing upwards supporting gold’s upward movement. Also we note that the RSI indicator is on the rise, nearing the reading of 70 and implying a strong bullish market sentiment for Gold, which could push its price even higher.
On the flip side, we note that Gold’s price is flirting with the upper Bollinger band, which may slow down the bulls and/or even cause a correction lower. Should the bulls maintain control over the bullion’s price, we expect it to breach the 2450 (R1) resistance line, which is also a all time high level and set as the next possible target for the bulls the 2525 (R2) resistance level.
Should the bears take over, we may see gold’s price falling, breaking the prementioned upward trendline in a first signal that the bullish movement has been interrupted and continue to break the 2375 (S1) support line clearly, setting in its sights the 2290 (S2) support base.
Avertissement :
Ces informations ne doivent pas être considérées comme un conseil ou une recommandation d'investissement, mais uniquement comme une communication marketing


