

Gold’s price has formed a new all time high figure near $3510 per troy ounce since our last report. Today’s report is to discuss the continued debate over the Fed’s independence, the recent tensions between Venezuela and the US, the upcoming US Employment data some data regarding Gold ETF inflows and we are to conclude the report with a technical analysis of gold’s daily chart.
Fed’s independence continues to be under threat
Issues with the Fed’s independence started last week as we mentioned in our previous report when President Trump published the letter stating “pursuant to my authority under Article II of the Constitution of the United States and the Federal Reserve Act of 1913, as amended, you are hereby removed from your position on the Board of Governors of the Federal Reserve, effective immediately”, in regards to Fed Governor Lisa Cook’s alleged indiscretions.
The most recent development in this case was the progression to a court of law, with Judge Jia Cobb asking both sides to file their arguments by today. Moreover, ECB Schnabel’s comments may have aided market worries, with Reuters quoting her as having stated that “If the loss of Fed independence happened – and I very much hope that it doesn’t – this would be very disruptive for the global financial system..”.
The comments made by ECB Schnabel highlight the global concern amongst policymakers about the possible risks posed by the Fed losing it’s ‘independent’ status. Hence, the longer the situation continues the higher the risk as the Fed’s next monetary policy meeting is quickly approaching and a lack of clarity may funnel inflows into gold given it’s safe haven asset status.
Venezuela-US tensions in sight
Tensions between Venezuela and the US have been on the rise following the increased military deployment in the Southern Caribbean and in particularly close to Venezuela. In response, Venezuela’s President Maduro stating that the US is seeking regime change and that “Venezuela is confronting the biggest threat that has been seen on our continent in the last 100 years” and that he was ready to “declare a republic in arms” if attacked by US forces.
On the other hand, the US administration is claiming the warships approaching Venezuela’s territorial waters are in an effort to combat drug trafficking. Moreover, if that wasn’t enough, Guyana which borders Venezuela and has had their own territorial issues with them in the past has claimed that a boat carrying election officials and ballot boxes was shot at “from the Venezuelan shore” with Venezuela denying the allegations.
Nonetheless, should a military conflict occur in the region it may spark concerns about a possible destabilization of the current dynamics in the area and could thus aid gold’s price given its safe haven asset status.
US Employment data
The US Employment data for August is set to be released this Friday. Our main focus will be on the unemployment rate which is expected to increase from 4.2% to 4.3% implying a loosening labour market.
In turn such implications may increase calls for the Fed to cut rates in their next meeting and could further solidify the market’s expectations of a rate cut, which may weigh on the dollar whilst aiding gold’s price given their inverse relationship with one another.
In conclusion should the unemployment rate for August come in at 4.3% or higher it may aid gold price, whereas a lower than expected unemployment rate could have the opposite effect.
Gold ETFs experience renewed support
According to a recent report by the World Gold Council, gold ETF’s faced the strongest inflows since mid-April, with the recent influx being attributed to increasing optimism about a possible rate cut by the Fed during their next meeting this month. In turn should inflows into gold continue in the coming week, it could possibly further aid gold’s price.
Gold Technical Analysis
XAU/USD Daily Chart
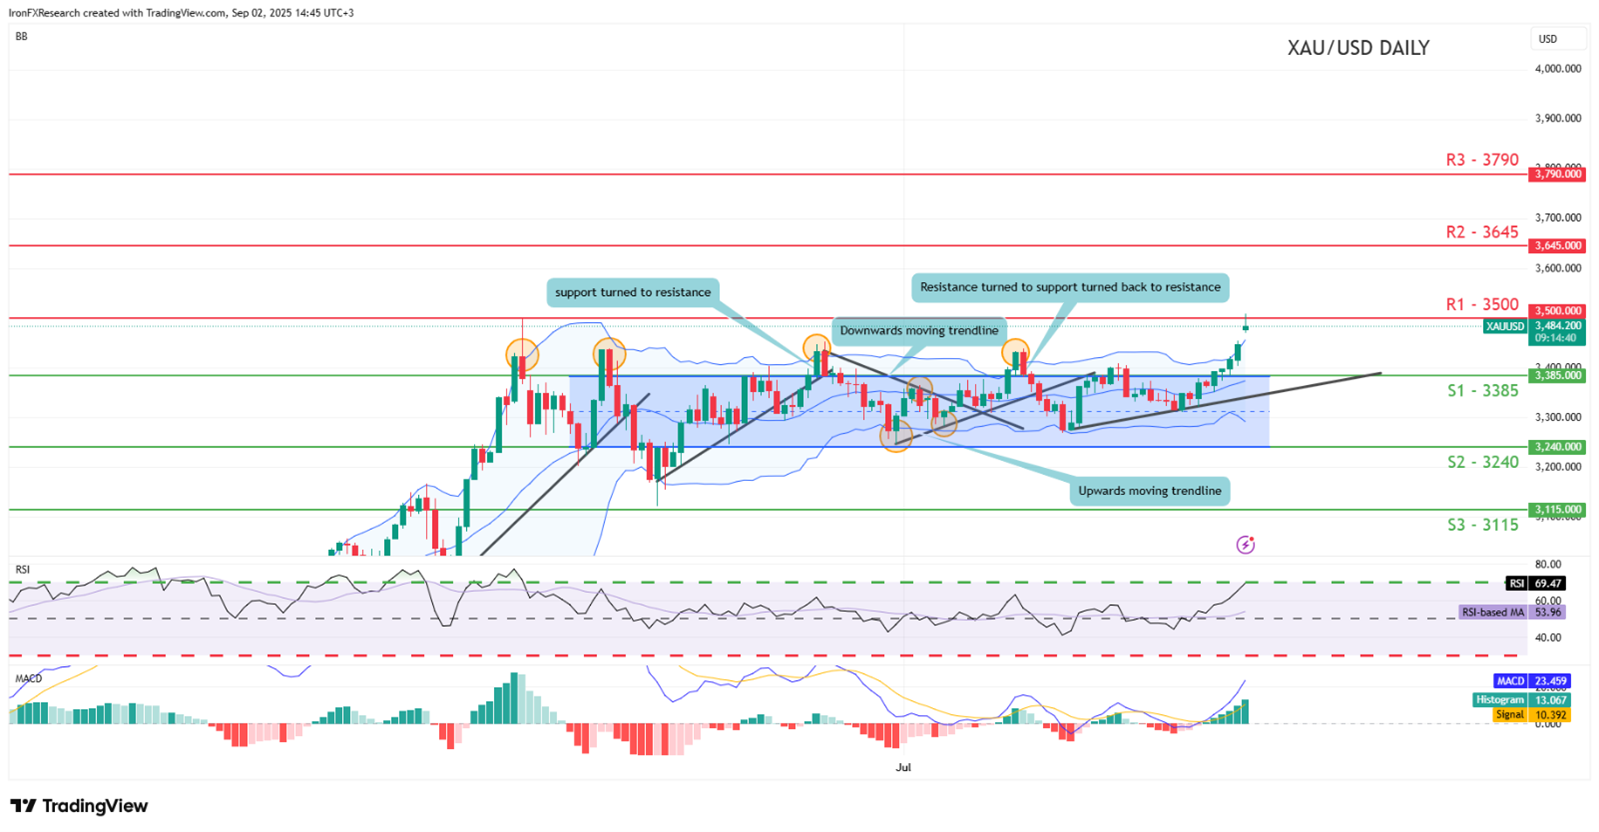
- Support: 3385 (S1), 3240 (S2), 3115 (S3)
- Resistance: 3500 (R1), 3645 (R2), 3790 (R3)
XAU/USD appears to be moving in an upwards fashion after reaching our 3500 (R1) all time high resistance level. We opt for a bullish outlook for the commodity’s price and supporting our case is the RSI indicator below our chart which currently registers a figure close to 70 implying a strong bullish market sentiment in addition to the MACD indicator.
However, we would also not be surprised to see a temporary retracement to lower ground in the short term. Nonetheless, for our bullish outlook to continue we would require a clear break above our 3500 (R1) resistance level with the next possible target for the bulls being the 3645 (R2) resistance level.
On the other hand, for a sideways outlook we would require the commodity’s price to remain confined between the 3385 (S1) support level and the 3500 (R1) resistance line, Lastly, for a bearish outlook we would a clear break below our 3385 (S1) support level with the next possible target for the bulls being the 3240 (S2) support line.
Avertissement :
Ces informations ne doivent pas être considérées comme un conseil ou une recommandation d'investissement, mais uniquement comme une communication marketing


