

Gold’s price has been dropping since last week, a drop that intensified as market worries tended to ease after the announcement of the US-Sino trade pact. Today we are to have a look at it along with other fundamental issues affecting gold’s price and for a rounder view conclude the report with a technical analysis of gold’s daily chart.
Negative correlation of gold and USD seems to be in effect
We make a start by noting that the negative correlation of the USD with gold’s price seems to be in effect over the past few days. It’s characteristic that gold’s has been dropping since last Wednesday while for the same period the USD index has been on the rise, escaping its past sideways motion. Hence, we tend to place considerable weight on USD’s direction at the current stage as a barometer for gold’s possible reverse direction. Should the USD Index continue to rise implying a continuance of the strengthening of the greenback against its counterparts, it could have an adverse effect on gold’s price. Furthermore, we also note that US yields have been on the rise in roughly the same period. It’s characteristic that the 2 year, 5year ,7year and 10 year US bond yields clearly rose in a uniform way which may stir interest among investors for US bonds as an attractive alternative to gold, thus diverting investments from the precious metal. Should US bond yields continue to rise, we may see them having a bearish effect on the shiny metal’s price.
Geopolitical tensions tend to ease
Overall we note an easing of tensions on a geopolitical level which tends to have a possible bearish effect on gold’s price. It’s characteristic that India and Pakistan have signed a truce which truth be told is rather uneasy, but in any case is a clear signal of de-escalation of the military conflict which was mentioned in last week’s report. Also Russia and Ukraine are preparing to start negotiations in Turkey, with Trump willing to join. Despite a resolution of the war in Ukraine is not expected, once again it’s a signal of de-escalation. In the Middle East, Trump is on a tour and we tend to speculate that he is trying to rekindle the Abraham accords, while the Palestinian Hamas has freed one American-Israeli hostage, also in a positive signal. Overall, should we see market worries for geopolitical tensions easing further, we may see such an easing having a bearish effect on gold given its safe haven status.
US-Sino trade deal improved market sentiment
The news which may have acted as a catalyst for gold’s downward motion yesterday was the announcement of a temporary US-Sino trade deal. Negotiations between the US and China over the weekend proved to be productive, according to statements from both sides, including comments by US secretary Bessent and China’s Vice Premier He Lifeng. The deal includes a substantial lowering of tariffs which the two countries have imposed on each other’s goods and is to be in effect for 90 days. The deal tends to resemble something like a trade war ceasefire, which is to give diplomacy a chance to find a solution on the problem and any further thawing of US-Sino trade tensions could have a bearish effect on gold’s price.
April’s US CPI rates could shake gold’s price
With the market sentiment improving from the US-Sino trade deal, attention of the market is shifted to the release of the April’s US CPI rates, in today’s early American session. A possible persistence of inflationary pressures in the US economy may intensify the doubts of the Fed for the necessity of extensive rate cuts, thus weighing on gold’s price while on the contrary a possible slowdown of the CPI rates could intensify the pressure on the bank for more rate cuts and intensify the market’s current expectations for the bank to deliver only two more rate cuts until the end of the year, thus supporting gold’s price.
Gold Technical Analysis
XAUUSD 4H Chart
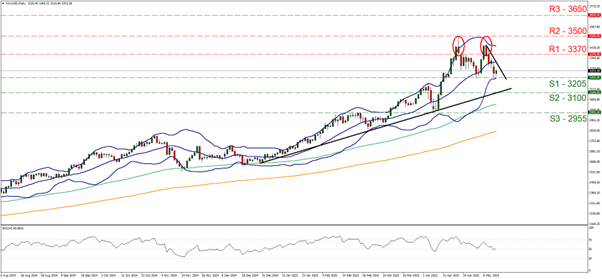
- Support: 3205 (S1), 3100 (S2), 2955 (S3)
- Resistance: 3370 (R1), 3500 (R2), 3650 (R3)
Since our last report gold’s price initially started to rise yet quickly corrected lower and since last Wednesday has been presenting bearish tendencies as yesterday the precious metal’s price has reached the 3205 (S1) support level.
It should be noted that the RSI indicator corrected lower reaching, but not breaching the reading of 50, implying that the bullish sentiment among market participants currently is not present, yet at the same time the fact that the indicator’s reading failed to materially drop below 50, tends to imply that the bearish sentiment is currently still lacking among market participants.
Yet in the big picture we have to note the upward motion of gold’s price since the beginning of the year, which seems to be culminating in the formation of a double top, with neckline being the 3205 (S1) support line. Yet the M formation, is still incomplete as the price action has to break clearly the S1.
Hence for time being, we tend to maintain a bias for a sideways motion of the precious metal’s price between the S1 and the R2. For the adoption of a bearish outlook, we would require gold’s price to clearly break the 3205 (S1) support line and start aiming if not breaking the 3100 (S2) support level.
A bullish outlook at the current stage seems remote, and for it to emerge the price action of gold has to breach the 3370 (R1) resistance line and continue to break also the 3500 (R2) resistance barrier, which is a record high level for gold’s price.
Avertissement :
Ces informations ne doivent pas être considérées comme un conseil ou une recommandation d'investissement, mais uniquement comme une communication marketing


