
We note that Dow Jones and Nasdaq, seem to have stabilised in the past week, while the S&P 500 seems to continue to be on the rise yet we note some difficulty for the index to reach higher highs. In the current report, we aim to shed light on the fundamentals for US equity markets as a whole, but also particular issues for specific high-profile companies or sectors and for a rounder view end the report with a technical analysis of the Nasdaq.
The Fed’s interest rate decision
Equities markets focus now turns to the Fed’s interest rate decision in the late American session today. The bank is expected to remain on hold, keeping rates at the 5.25-5.50% range. Currently, Fed Fund Futures (FFF) imply a probability of 99% for such a scenario to materialise, rendering the interest rate decision largely as an open and shut case. Hence, we may see the market attention turning to the accompanying statement, the new dot plot and Fed Chairman Powell’s press conference, half an hour later. FFF also imply that the market, currently, expects the bank to start cutting rates in June and deliver 3 rate cuts in total. From an equities perspective, we tend to expect that any hawkish elements could weigh on US equities, as stocks are considered riskier assets, as the market sentiment may turn more cautious. Should we break down the three prementioned remaining elements, we note that should the accompanying statement and Fed Chairman Powell’s press conference, be characterised by a hawkish tone, contradicting market expectations and implying that high rates are to be maintained for longer, we may see the US equities slipping, while should the bank allow for some innuendos that rate cuts are nearing, we may see US equities rising. On the other hand, should the new dot plot reaffirm the market’s expectations for a total of three rate cuts in the year, we may see US equities rising, while should the dot plot imply fewer rate cuts, possibly two, we may see US equities retreating.
NVIDIA’s AI conference
The market’s AI frenzy seems to have been re-energized on Monday after Nvidia organizing its first GTC Conference on Monday. The conference had as a protagonist the company’s next-generation chip, practically showcasing the possibilities the technology promises. According to Financial Times the company’s CEO Jensen Huang stated that Nvidia’s Blackwell graphics processing units would massively increase the computing power driving large language models. The Blackwell GPU has 208bn transistors, compared with 80bn in last year’s H100, in a measure of its increased power. It should be noted that Nvidia’s share price had started to stabilise over the week after a substantial rally since the start of the year. We expect that the event could provide a new push and allow Nvidia to capitalise on the gains. Overall despite the share’s price being at record highs and prone for a possible correction lower, we still have a positive outlook on a fundamental basis.
Apple’s conflicting fundamentals
Staying in the tech sector we noted that Apple’s share price seems to have taken a slight upward trajectory in the past two weeks. Yet we tend to maintain our worries for the reduced revenue of Apple stemming from China. It should be noted that Apple seems to be getting increased competition from Chinese companies, while at the same time, there is an adverse business environment for Apple over there over the past six months. We note that Apple’s CEO Tim Cook went to China, for the opening of a new store in Shanghai, showing that top management is placing substantial emphasis on the Chinese market. Also we note that Apple has approached and is in discussions with Google in an effort to jointly develop Artificial Technology. Overall the possibility of Apple expanding substantially in AI, could provide some support for its share price, given the AI frenzy of the market.
Analyser la technique
#US100 Cash Daily Chart
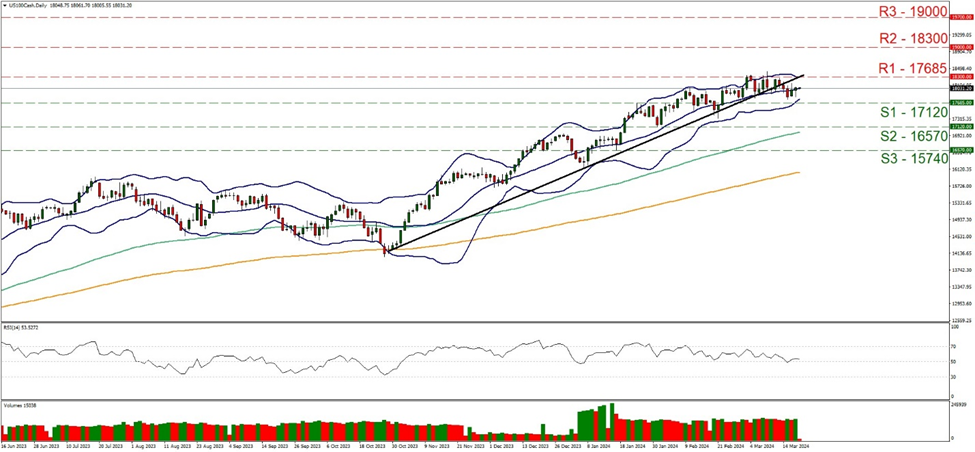
Support: 17120 (S1), 16570 (S2), 15740 (S3)
Resistance: 17685 (R1), 18300 (R2), 19000 (R3)
Nasdaq on a technical level, seems to have stabilized its price-action in the corridor set by the 14685 (R1) and the 17120 (S1) levels. Given also that the RSI indicator remains near the reading of 50, implying a rather indecisive market we tend to maintain our bias for the sideways motion to be maintained. In addition to the above we also note the narrowing of the Bollinger Bands, which tends to imply lower volatility that could allow the sideways motion to continue. For a bullish outlook, we would require the index to break the 17685 (R1) resistance line, with the next possible target for the bulls being the 18300 (R2) resistance level. Should the bears take over, we may see the index breaking the 17120 (S1) support line aiming for the 16570 (S2) support base.
Si vous avez des questions d'ordre général ou des commentaires concernant cet article, veuillez envoyer un email directement à notre équipe de recherche à l'adresse research_team@ironfx.com
Avertissement :
Ces informations ne doivent pas être considérées comme un conseil ou une recommandation d'investissement, mais uniquement comme une communication marketing. IronFX n'est pas responsable des données ou informations fournies par des tiers référencés, ou en lien hypertexte, dans cette communication.


