
US stockmarkets tended to remain rather inactive since the start of the week, given also that we are in the holiday period for the US but also other parts of the world, yet Volatilité could reemerge altering the direction of stocks.
July’s US employment report weakens US stockmarkets
It should be noted that Volatilité was on display on Friday as US stockmarkets retreated substantially. The driving force behind the movement was the release of the US employment report for July, which showed some solid rates et figures for the US employment market in the past month. We note that that the NFP figure did not drop as expected, instead jumped to twice the number of jobs the market anticipated to be released, reaching 528k. Also the unemployment rate ticked down implying that the US employment market remains tight and the average earnings growth rate remained unchanged instead of slowing down on a year on year level, as was expected, implying that wages are to continue to feed inflationary pressures in the US economy. So in a nutshellle release showed that there is still, even marginallyle possibility for further tightening and the US employment market extended it’s ability to create new jobs while also it’s still feeding inflationary pressures in the US economy. On a monetary levelle release intensified market expectations for the Fed to continue to hike rates at a fast pace. Furthermore we would note that Fed Governor Bowman stated, that additional 75 basis points rate hikes could be considered from the Fed in order to bring inflation down to 2%. Overall and given that the Fed’s intentions to drain the market from excess liquidity remain unchanged, even with the risk of the US economy entering a recession, we may see the market sentiment remaining risk averse, which could weaken US stockmarkets as it would imply less investment opportunities and possibly even weaker earnings results in the coming months.
July’s US CPI rates the next big test
The next big test is expected to be the release of the US CPI rates for July today the 10 of August. The headline rates are expected to slow down both on a month on month level as well as on a year on year level and reach 0.2% mom and 8.7% yoy respectively. Should the actual rates slow down as expected, it could signal a big win for the Fed and its efforts to curb inflationary pressures. On a market reaction level the release, if the forecasts are realised, could support US stockmarkets as it would imply that the pressure on the Fed to continue to hike rates at a fast pace could ease, given that the slow down may imply that inflation has peaked and may have started to roll back down to the bank’s target of 2% yoy.
Elon Musk sells Tesla shares
In the current headlines we note the news that Elon Musk sold 7.92 million Tesla actions worth $6.88 billion. It seems that the sale was related to the Twitter deal, as when asked if he was done selling actions of Tesla and has any intentions to buyback actions he replied that “Yes. In the (hopefully unlikely) event that Twitter forces this deal to close and some equity partners don’t come through, it is important to avoid an emergency sale of Tesla stock.”. It’s important to note that the share sale was performed between the 5 and 9 of August according to SEC filings, as reported by CNBC. It should also be noted that Elon Musk had stated near the end of last April that no further Tesla shares are planned to be sold. The inconsistency is a bit worrying and may strengthen expectations that Twitter will be able to enforce the deal which if actually so could provide some further support for its share price, after the boost it got on the 5 of August.
US 30 Cash, H4 Chart
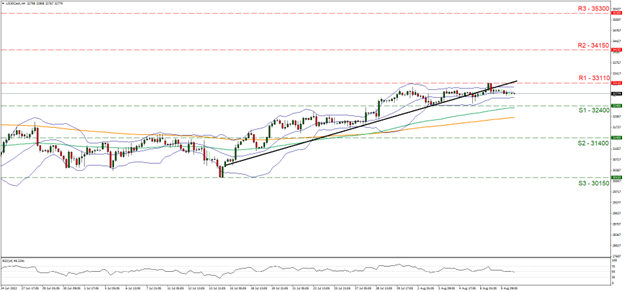
Support: 32400 (S1), 31400 (S2), 30150 (S3)
Resistance: 33110 (R1), 34150 (R2), 35300 (R3)
We decided to keep the technique analysis of the Dow Jones for comparison reasons in regards to our last report, yet made some slight re-adjustments of the support levels to better reflect the boundaries set by the index’s movement. Overall the index maintained its sideways motion between the 33110 (R1) resistance line and the 32400 (S1) support level. It should be noted that the index in its sideways motion broke the upward trendline incepted since the 14 of July, forcing us to switch our bullish outlook in favour of a sideways movement currently, between the prementioned levels and change our outlook we would require a clear breaking of either of them. Please also note that the RSI indicator is running along the reading of 50 also implying a rather indecisive market, while the Bollinger bands have narrowed et levelled out, also implying for the time being a sideways motion. Yet should the bulls take over, we may see the index clearly breaking the 33110 (R1) resistance line and take aim for the 34150 (R2) level that has reversed the index’s upward motion on the 5 of May. On the flip side should the bears dominate the index’s direction, we may see it breaking the 32400 (S1) support line which forms the lower boundary of the current sideways motion and take aim of the 31400 (S2) support line that provided resistance on the 8 of July, yet as the price action has risen above it, has switched roles into being a support level.
Si vous avez des questions d'ordre général ou des commentaires concernant cet article, veuillez envoyer un email directement à notre équipe de recherche à l'adresse research_team@ironfx.com
Avertissement :
Ces informations ne doivent pas être considérées comme un conseil ou une recommandation d'investissement, mais uniquement comme une communication marketing. IronFX n'est pas responsable des données ou informations fournies par des tiers référencés, ou en lien hypertexte, dans cette communication.


