

There seemed to be relatively low volatility for oil prices since last week’s report. In the current report, we intend to have a look at the state of the US oil market, the role of the USD in determining oil prices and the production outlook of OPEC and Russia under the prospect of the OPEC+ meeting on June 1 . To conclude the report we will also provide a technical analysis of WTI’s daily chart.
Slack in the US oil market
We start our analysis of the US oil market by having a look at the release of the Baker Hughes oil rig count. The release indicated that the number of active oil rigs in the US increased by one. But it’s not the increase as such that matters, it’s the fact that the downward trajectory of the number of active oil rigs over the past four weeks has been, even temporarily interrupted, which of its own is an encouraging sign yet not conclusive for increased demand of oil in the US market.
Yet on Tuesday, API reported an increase of oil inventories by 2.48 million barrels a release that reversed the sentiment which had started to emerge for a possibly tight US oil market by API a week ago. Furthermore, the argument for a slack in the US oil market was further enhanced as on Wednesday EIA also reported an increase of US oil inventories, albeit narrower if compared to API’s, of 1.825 million barrels.
Overall, currently, we see the case for the demand side of the US oil market not being able to surpass production levels thus creating a surplus of production that may weigh on the price of oil. Should there be additional signs of a slack in the US oil market, maybe even widening slack, we may see oil prices on an international level being on the retreat.
Tight monetary conditions in the US to be maintained?
Another issue we would like to address is the release of the Fed’s last meeting minutes. The document showed a predisposition to keep rates high to ensure the return of the US CPI rates to the bank’s 2% target. The contents of the document practically contradicted the market’s expectations for earlier rate cuts and forced it to reposition itself.
Despite the release seemingly being unlinked with the path of oil prices, our worries tend to focus on the idea that should financial conditions in the US economy remain tight for longer, we may see economic activity in the US manufacturing sector suffering thus lowering oil demand and consequently oil prices.
On second base we also note that the USD may get some support from the prolonged tight monetary conditions in the US, and a possibly stronger greenback could have an adverse effect on oil demand on an international level, as a wide amount of oil transactions are completed with payments in USD for a number of oil-importing economies and thus oil in effect may get costlier.
OPEC+ and Russia
We make a start with our OPEC comment by noting that the group of oil-producing economies is set to meet on June 1 next week. We would not be surprised to see the group trying to tighten even further the supply side of the commodity on an international level, which may prove beneficial for the commodity’s price.
A possible rollover of the production cuts seems to be the most possible scenario currently, yet we would not be surprised to see OPEC announcing even deeper production cuts, which could provide asymmetric support for oil prices.
Hence up to the week leading to the meeting, should there be signals by OPEC officials or even market analysts trying to prepare the markets for a possible tightening of the international oil market, we may see oil prices gaining.
In the same spectrum, we also note the announcement of Russia’s Energy ministry that stated that Russia exceeded its OPEC+ production quota in April for “technical reasons” and will soon present to the OPEC Secretariat its plan to compensate for the error, according to Reuters.
We do not place much weight on the “technical reasons” which sound as an excuse, but the intention to reduce production seems to be obvious, yet additional signals may be required for the intentions to be convincing.
Overall, the announcement tends to highlight the prospect of low production levels thus a tightening of the international oil market and additional signs to that direction could support oil prices.
Analyser la technique
WTI Cash Daily Chart
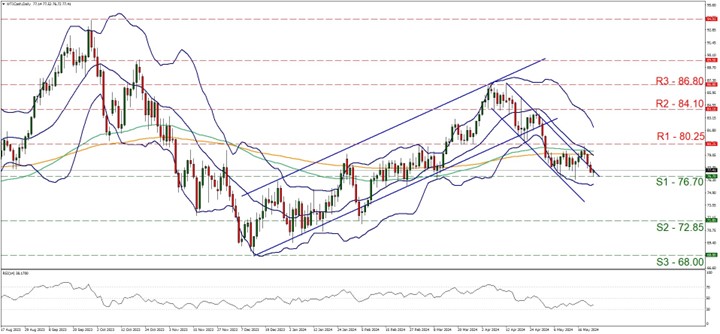
- Support: 76.55 (S1), 71.50 (S2), 66.95 (S3)
- Resistance: 81.80 (R1), 85.85 (R2), 89.60 (R3)
WTI’s price seems to have bounced once again on the 76.70 (S1) support line. It should be noted that the movement of the commodity’s price action during today’s Asian and European sessions, seems to underscore the interruption of the downward movement characterising oil’s price since the 12 of April. Hence we switch our bearish outlook in favour of a sideways motion bias in the corridor set by the 80.25 (R1) resistance line and the 76.70 (S1) support level, for the time being.
On the flip side the RSI indicator remains at relatively low levels implying a residue of bearish sentiment among traders. Should the bears take over once again the direction of the price action for oil, we may see WTI’s price breaking the 76.70 (S1) support line, taking aim of the 72.85 (S2) support level. For a bullish outlook, the bar is high as we would require the commodity’s price to rise, break the 80.25 (R1) resistance line and thus pave the way for the 84.10 (R2) resistance level.
Avertissement :
Ces informations ne doivent pas être considérées comme un conseil ou une recommandation d'investissement, mais uniquement comme une communication marketing.


