The volatility that was present in the markets during the past week, provided a rollercoaster ride for gold’s price, yet the precious metal’s price appears to have roughly stabilized. Today we are to discuss the fundamental challenges laid ahead for the precious metal, while we will be concluding this report with a technical analysis of gold’s daily chart.
US CPI rates today, set to cause waves
The release of the US CPI rates later on today, could heavily influence the precious metal’s direction, as the financial release may be considered as the next big test for gold’s price. Economists are expected the US CPI report to showcase easing inflationary pressures in the US economy, with the headline CPI rate on a year-on-year level is expected to come in at 2.9%, implying that inflation is increasing at a decreasing rate.
Should the CPI print come in as expected, the release could potentially weigh on the greenback, as it could validate the current markets expectations of 5 rate cuts this year, which in turn could support gold’s price. On the other hand, should the CPI rates come in higher than expected, essentially implying that inflationary pressures persist in the US economy, it could potentially provide support for the dollar, which in turn could weigh on the precious metal, given their inverse relationship with one another.
Fed officials and their influence on Gold’s price
Fed Officials over the past week appear to have backed, Fed Chair Powell’s comments, who implied that monetary policy may have to remain restrictive until more data is available to the Fed. In particular, we highlight the comments made by Minneapolis Fed President Kashkari who last Thursday stated at “At the moment, two to three rates cuts this year seems appropriate”, which could imply that the current Fed Funds Futures expectations of 5 rate cuts by the Fed this year, may be overoptimistic. Furthermore, on Monday, Fed Governor Bowman stated that it is “too soon to predict” when the Fed should start cutting rates, or how far they will go, seemingly agreeing with Fed Chair Powell and Minneapolis Fed President Kashkari.
Overall, the hawkish rhetoric emerging from the Fed that interest rates may have to be kept at their current levels for a prolonged period of time, may have provided support for the greenback since last week and thus may have weighed on the precious metal. Yet the intensity of the hawkish rhetoric by Fed officials could vary depending on the release of the US CPI rates, which we covered in our previous paragraph.
Should the CPI rates showcase easing inflationary pressures, we may see Fed officials adopting a less hawkish tone, which could weigh on the greenback which in turn could provide support for gold’s price. Whereas, should the CPI rates come in higher than expected, it could intensify the hawkish rhetoric emerging from Fed officials, thus potentially aiding the dollar, whilst weighing on the price of the precious metal.
Upcoming releases from the US
We expect financial releases to guide gold’s price in the next few days given that some US high-impact financial releases are expected to be released, with special focus being placed on the US Retail sales rate for January. Yet we would note the release of the US Philly Fed Business Index figure for February on Thursday and the University of Michigan Preliminary consumer confidence figure for February on Friday.
Gold: Technical Analysis
XAUUSD Daily Chart
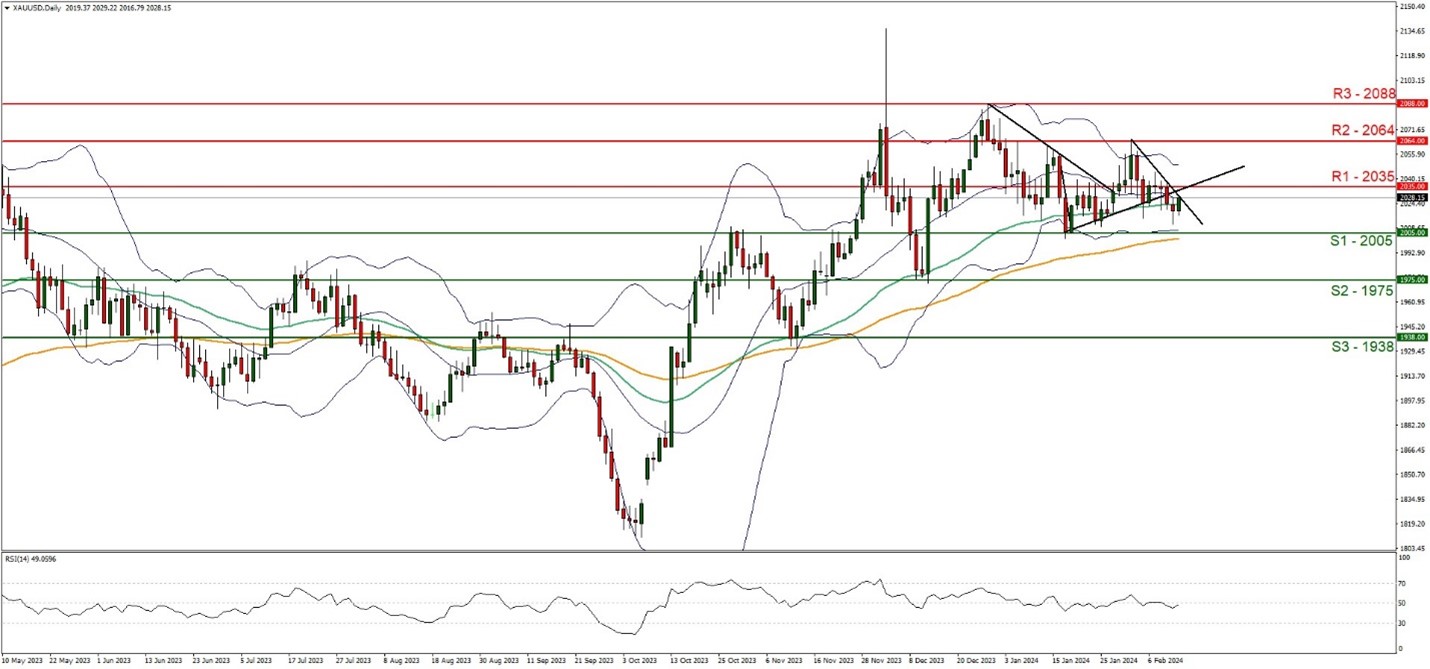
- Support: 2005 (S1), 1975 (S2), 1938 (S3)
- Resistance: 2035 (R1), 2064 (R2), 2088 (R3)
On a technical level, we note that gold’s price appears to have recovered slightly since the beginning of the week. We maintain sideways bias for the precious metal, and supporting our case is the RSI indicator below our chart which currently registers a figure near 50, implying a neutral market sentiment, yet we would quickly switch our sideways bias for a bearish outlook should the precious metal break below the 2005 (S1) support level.
Nevertheless, for our sideways bias to continue, we would like to see the precious metal remain confined between the 2005 (S1) support level and the 2035 (R1) resistance line. On the other hand, for a bearish outlook, we would like to see a break below the 2005 (S1) support level, with the next possible target for the bears being the 1975 (S2) support base. Lastly, for a bullish outlook we would like to see a clear break above the 2035 (R1) resistance line with the next possible target for the bulls being the 2064 (R2) resistance level.
Avertissement :
Ces informations ne doivent pas être considérées comme un conseil ou une recommandation d'investissement, mais uniquement comme une communication marketing.


