

WTI appears to be ending the week, higher than last week, with markets ending four weeks of uncertainty for the commodity’s next leg. Oil traders appear to have decided on oil’s next direction, with economic recovery prospects in China increasing, an apparent increase in oil demand, combined with a reduction in oil production in the US, appear to have provided some clarity for oil traders. In this report we aim to shed light on the catalysts driving WTI’s price, assess its future outlook and conclude with a technical analysis.
Oil: Overview Report
Weather problems hurt oil production
According to the EIA, production in the U.S fell by an “estimated decrease of 1 million barrels per day, representing an estimate of impact of winter storms and extreme cold temperatures”. The reduction in production, due to weather events could restrict the supply of oil, and as such could have aided oil prices to higher ground. Should the extreme weather phenomena continue in the U.S and continue to hinder oil production, we could see prices being supported and vice versa.
Crude oil inventories and Baker Hughes point to an increase in demand
On another note, the US crude oil inventories pointed to a significant increase in oil demand during the past week, with the API weekly crude inventories figure reporting on Wednesday, that crude oil inventories in the US decreased by minus six point six hundred and seventy four million barrels, which is much higher than the expected drawdown of minus two point four million barrels. Moreover, the EIA weekly crude oil inventories figure indicated a greater drawdown that what was expected, by coming in at minus nine point two hundred and thirty three million barrels versus the expected figure of minus two point fifteen million barrels, appeared to confirm the API figure of an increase in demand for oil. As such, with both figures appearing to validate the increase in demand, it may have translated to higher oil prices.
On another note, the Baker Hughes oil rig count which was released last Friday, continued to decrease, with the total oil rig count coming in at four hundred and ninety seven. There are two scenarios that might be in play with a declining oil rig count. The first being that efficiency from existing oil rigs may be increasing and as such, the existing oil rigs could increase their production, which in turn could support oil prices in the long run. The second scenario could be that demand for may be decreasing on a macro level, thus should the reduction in total oil rigs continue, it could weigh on oil prices in the long run.
China stimulus package
According to Reuters, China’s central bank announced a deep cut to bank reserves on Wednesday, a move which the article claims will inject approximately one hundred and forty billion dollars in cash into the Chinese banking system. The potential cash injection into the economy could kickstart economic recovery prospects, for a nation whose economic activity has been underwhelming ever since covid measures were lifted.
As such, with the potential strong message being sent to the markets that the Government will protect the economy, it could lead to higher demand for oil from the world’s largest importer, should economic activity pick up. Therefore, the expectations of oil demand from China potentially increasing could provide support for the liquid gold’s price.
Oil: Technical Analysis
WTI Cash H4
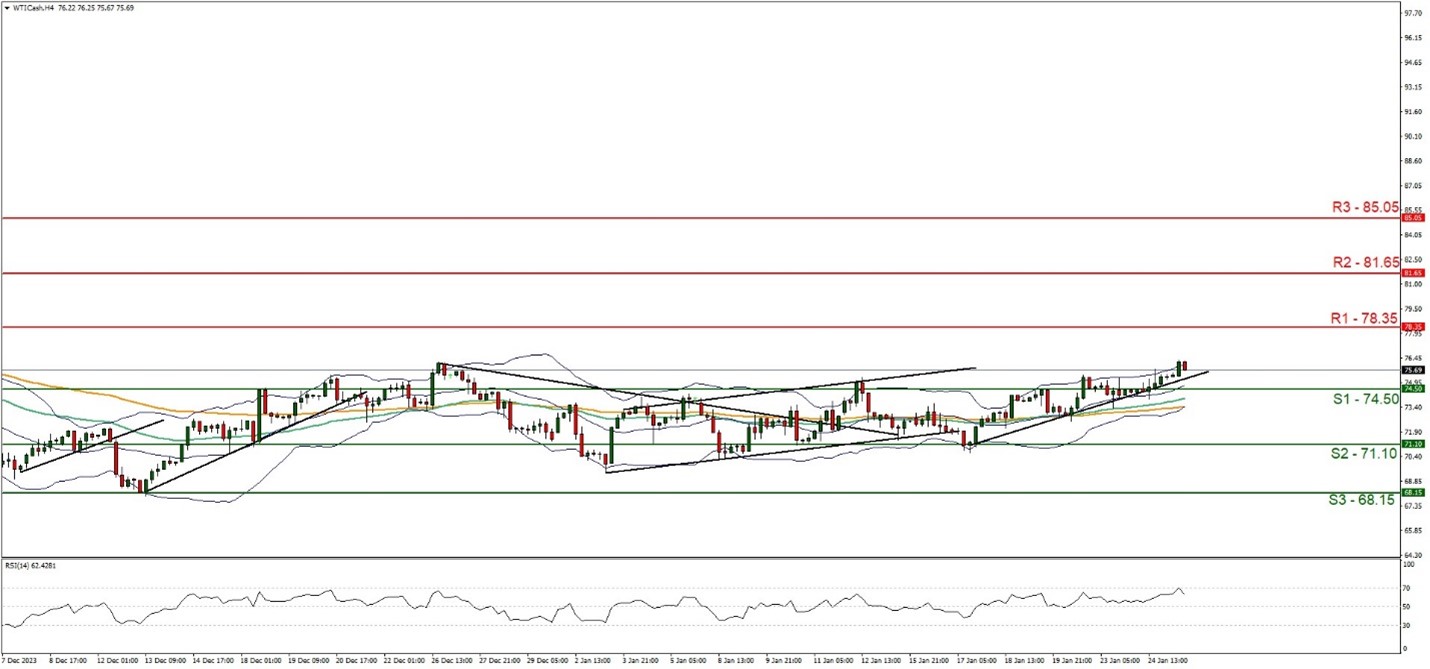
- Support: 74.50 (S1), 71.10 (S2), 68.15(S3)
- Resistance: 78.35 (R1), 81.65 (R2), 85.05 (R3)
Looking at WTICash 4-hour chart we observe the price action appears to be moving in an upwards fashion, with the pair now appearing to have broken four weeks of market indecisiveness. We maintain a bullish outlook for the commodity and supporting our case is the RSI indicator below our chart which currently registers a figure of sixty, implying a bullish oil market sentiment, in addition to the formation of an upwards moving trendline which was incepted on the 17
For our bullish outlook to continue, we would like to see a break above the seventy eight point thirty five (R1) resistance level, with the next possible target for the bulls being the eighty one point sixty five (R2) resistance ceiling. On the other hand, for a bearish outlook, we would like to see a clear break below the seventy four point five (S1) support level, with the next possible target for the bears being the seventy one point ten (S2) support base.
Yet, we should note that the distance between our S1 and R1 levels, is fairly narrow and as such could easily be broken. Nonetheless, for a bullish outlook, we would like to see a clear break above the 73.30 (R1) resistance line, with the next possible target for the bulls being the 76.35 (R2) resistance level. Lastly, for a bearish outlook, we would like to see a clear break below the 71.30 (S1) support level, with the next potential target for the bears being the 68.20 (S2) support line.
Avertissement :
Ces informations ne doivent pas être considérées comme un conseil ou une recommandation d'investissement, mais uniquement comme une communication marketing.


