The markets were stunned by gold’s rally in Monday’s Asian session. The spike that drove gold’s price to record high levels tended to underscore the wide volatility characterizing its price action and the possibilities for gold traders. Today we are to discuss the fundamentals that underpinned the rally while also having a look at the challenges laid ahead for the precious metal, and we will be concluding this report with a technical analysis of gold’s daily chart.
Gold Market Report
Consecutive rate cuts expected
Monday’s rally may have been in the works for some days now, and its characteristic of how our last report ended with a clear-cut bullish outlook for the precious metal. Yet the actual price action surpassed our expectations.
On a fundamental level, we note that the market’s expectations for the Fed to proceed with consecutive rate cuts in the coming year seemed to intensify, which in turn also tended to highlight the possibility of US bond yields dropping, polishing the shiny metal even further. It’s characteristic of the market’s dovish expectations that currently Fed Fund Futures imply that the bank may proceed with five rate cuts in 2024, while some analysts tend to mention the possibility of even six rate cuts.
On the other hand, we tend to view the market’s expectations as possibly overextended, and for the time being, we expect the Fed to delay any rate cuts until it feels certain that inflationary pressures are under control and near, if not just below, the bank’s 2% target.
In any case, Fed Chairman Powell’s speech last Friday was pivotal in the sense that, despite the Fed Chairman stating that the rates are well at restrictive levels, implying that the Fed is done with hiking rates, it also tended to imply that the bank may keep rates at high levels for a prolonged period. Yet Powell failed to convince the markets, and its characteristic that gold’s price, despite some slight hesitation in the late hours of the American session, ended Friday in the greens Should the market’s expectations for a considerable easing of the bank’s restrictive monetary policy in 2024 intensify, we may see gold’s price rise once again and vice versa.
US data ahead and Gold’s negative correlation with the USD
Overall, we note the absence of any statements by Fed policymakers in the coming week given the blackout before the bank’s December 13 interest rate decision; hence, we expect gold’s price to be led by fundamentals as well as financial releases due out.
In the coming days, we will note the release of the US ISM non-manufacturing PMI figure for November, yet the highlight of the week is expected to be the release of the US employment report for November on Friday.
Should the release take the markets by surprise, we may see it moving the markets, with ripple effects also visible in the gold market as well. If the data show an easing of the US employment market’s tightness, adding more pressure on the Fed to proceed with rate cuts earlier, that could provide some support for gold’s price and vice versa.
On a deeper fundamental level, we note that the proceeding analysis implies a continuation of the negative correlation of the USD with gold’s price. The past three weeks seemed to verify the validity of this negative correlation, as gold was on the rise while the greenback tended to edge lower. Yet the dynamics seem to have eased a bit, as the rise of gold’s price seems to be a bit asymmetrically wider about the weakening of the USD Index.
Gold – Technical Analysis
XAUUSD 4-Hour Chart
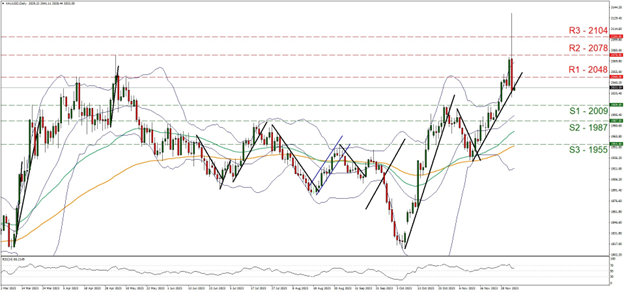
- Support: 2009 (S1), 1987 (S2), 1955 (S3)
- Resistance: 2048 (R1), 2078 (R2), 2104 (R3)
On a technical level gold’s price rallied reaching all-time highs, peaking at $2136 on Monday’s Asian session, yet corrected quickly lower by retreating beneath the 2048 (R1) support line, now turned to resistance. In its correction, the precious metal’s price seems to have broken the upward trendline guiding it since the 13th of November. Furthermore, we note that the RSI indicator retreated below the reading of 70 and seems to be stabilizing above 50.
We tend to switch our bullish outlook, given that the aforementioned upward trendline seems to have been broken, in favor of a bias for a sideways motion for the time being. Nevertheless, we note that the bullish tendencies are there, given that all three moving averages on our chart, namely the 20 (Bollinger band median), 50 (Green line), and 100 (Orange line) are pointing upwards.
On the flip side, the precious metal’s price is still at relatively high levels and may have more room to move to the downside. Should the bulls regain control over gold’s price, we may see it breaking the 2048 (R1) resistance level and aim for the 2078 (R2) resistance nest. Even higher we note the 2104 (R3) resistance hurdle. Should the bears take over, we may see gold’s price breaking the 2009 (S1) support line and aiming for the 1987 (S2) support level, a scenario that would allow us to draw a downward trendline, showing also the limitations of a possible downward movement. Even lower and for a more bearish scenario we note the 1955 (S3) support barrier.
Avertissement :
Ces informations ne doivent pas être considérées comme un conseil ou une recommandation d'investissement, mais uniquement comme une communication marketing.


