Gold seems to have maintained a sideways motion with the main body of prices being contained in the $1950-$1972 range. Overall we tend to maintain the view that the negative correlation of the USD with gold’s price seems to be maintained and may be the main factor behind the movement of gold’s price. In this report, we aim to shed light on the catalysts driving gold’s price, assess its future outlook and conclude with a technical analysis.
Minor boost from the Fed’s interest rate decision
On Wednesday, gold’s price tended to gain somewhat, yet the effect of the Fed’s interest rate decision remained rather modest. The Fed as was expected delivered the 25 basis points rate hike yet provided little new for market participants. In its accompanying statement, in our opinion, the bank seems to have removed its predisposition for more rate hikes and is now more data-dependent. It’s as if the bank accepts that it has reached the end of its rate hiking cycle yet at the same time keeps the door open for another rate hike in the September meeting if necessary. The release overall was viewed as leaning towards the dovish side and tended to weaken the USD yet at the same time strengthen gold as mentioned before.
Acceleration of US GDP Rate hits gold’s price
Yet the main fluctuation of gold’s price in the past week may have been caused by the release of the preliminary US GDP advance rate for Q2. The rate accelerated instead of dropping as expected, highlighting the resilience and the prospects of the US economy, easing market worries about the outlook of the US economy and enhancing the possibility of a soft landing. At the same time, the weekly initial jobless figure came in lower than expected, implying that the US employment market may not be as loose as expected. Both financial releases, but primarily the former tended to provide a bullish boost to the greenback and weaken gold’s price.
Easing of inflationary pressures and the role of US yields
On Friday, fresh data showed that inflationary pressures continued to be on the retreat in June. The release of the Core PCE Price index rate, the Fed’s favorite inflationary measure, slowed down beyond market expectations, reaching 4.1% yoy, while the headline PCE price index also slowed down, both stocking market expectations for the Fed to halt its rate-hiking path as on Wednesday’s interest rate decision the Fed stated that “The Committee’s assessments will take into account a wide range of information, including readings on labor market conditions, inflation pressures and inflation expectations, and financial and international developments”.
Hence the release tended to weaken the USD and at the same time support gold’s price. The scenario of the Fed halting its rate hiking path, if combined with the stronger preliminary GDP rate for Q2, enhanced the market’s expectations that the US economy will be able to avoid a recession.
The role of US yields and risk events ahead
It should be noted that given the above analysis, the acceleration of the GDP advance rate for Q2 and given that market worries for a possible soft landing of the US economy, may have been enhanced, the yields of US bonds tended to retreat, which more or less tended to enhance the attractiveness of the precious metal. In the coming days, we expect fundamentals to play a key role regarding gold’s price yet at the same time we note that there are key releases that could influence gold’s direction.
We note today the release of the US ISM manufacturing PMI figure for July, on Thursday we get the weekly initial jobless claims figure and the factory orders growth rate for June and we highlight the release of the US employment report for July on Friday and should the data show that the US employment market remains tight and provides support to the USD, we may see the release weighing on gold and vice versa.
Analyser la technique
XAUUSD H4 Chart
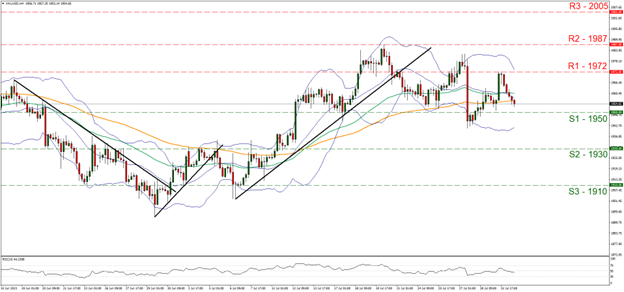
- Support: 1950 (S1), 1930 (S2), 1910 (S3)
- Resistance: 1972 (R1), 1987 (R2), 2005(R3)
Gold hit a ceiling on the 1972 (R1) resistance level and is on the retreat in the past 24 hours, yet the sideways motion seems to be maintained for now. We note that the RSI indicator is dropping and just broke below the reading of 50, yet remains unconvincing for a clear bearish sentiment in the market for now. On the other hand both the 50 (Green line) and 100 (Orange line) moving averages seem to have flattened out and run in parallel, which tend to support the idea of a sideways direction.
On the other hand, the more sensitive 20-moving average, which is also the median of the Bollinger bands, is pointing slightly downwards, suggesting some slight bearish sentiment. Yet for a clear-cut bearish outlook, we would require the bullion’s price action to break the 1950 (S1) support line and start aiming for the 1930 (S2) support level. In case we see a buying interest being expressed by gold traders, we may see gold’s price reversing the losses of the past 24 hours, breaking the 1972 (R1) resistance line and aiming if not breaching the 1987 (R2) resistance level.
Avertissement :
Ces informations ne doivent pas être considérées comme un conseil ou une recommandation d'investissement, mais uniquement comme une communication marketing.


